Exploring our grocery numbers
Posted: - Modified: | quantifiedAnalyzing my grocery data is more challenging than analyzing my time data. There’s a lot more data cleanup needed. I have to figure out obscure line items on old receipts and catch typos in both names and numbers. Then there’s figuring out how much I want to combine different items and how much I want to keep them separate.
For example, milk has different receipt item names depending on the item (size, brand, type) and the store. If I want to know how much we’ve spent on milk, I’ll use the total for all of them. But if I want to get a sense of the price history, it makes sense to track each receipt item type separately. I do this by keeping the receipt name (fixing typos as I review my data) and mapping these receipt names to a friendly name I set for myself. This way, the line “HOMO 4LI” on my receipt gets turned into “Milk” in my report. Come to think of it, maybe I should change it to “Milk, 4 L, Homogenized”…
Categories are handy for reporting too. Because of the ad-hoc way I created receipt item mappings and assigned them to categories, I ended up with inconsistent categorization. Some types of toilet paper were in the Supplies category, and some types were in the Other category. I manually reviewed the category assignments and I think I’ve gotten them sorted out.
Anyway, analyzing my data from 2013-07-01 to 2015-07-01, I see that we spend an average of $80 per week on groceries, which sounds about right. Some of the receipts are missing and there are almost certainly other little errors in the data, but this should give me the overall picture.
I’m still trying to figure out a good way to visualize the data in order to answer the questions I’m curious about, so here are my notes along the way. X axis is date, Y axis is total cost on that day, color is how it compares to the average price it is (lower price than average = blue, higher = orange).
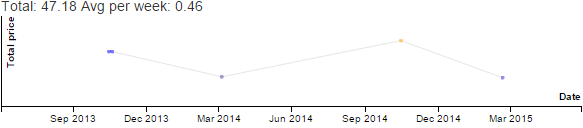
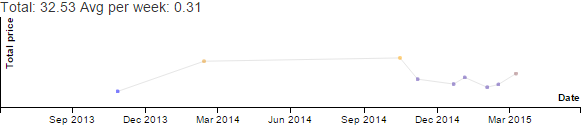
Milk
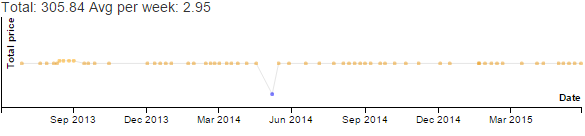
Milk consumption is pretty straightforward. Every week, we use around 0.6 bags of milk (~2.4L) – more when J- and her friends are over (teenagers!). The price of milk has stayed at $4.97 per 4L, except for the time we bought a slightly more expensive type of milk (~Oct 2013) and the time in June 2014 when a smaller size was on sale, so we picked up one of those instead.
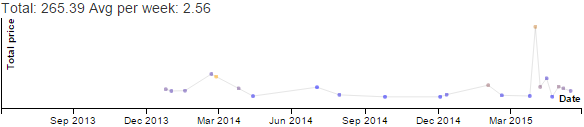
Eggs
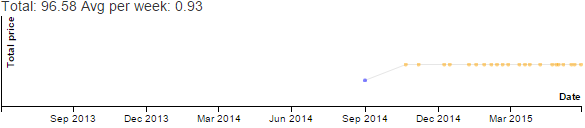
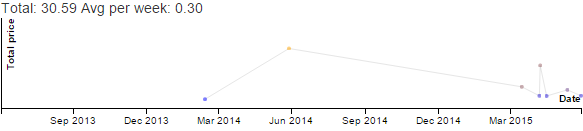
We used to buy extra-large eggs, but the supermarket close to us stopped carrying 18-packs of those, so we switched to 18-packs of large eggs instead.
Extra-large eggs
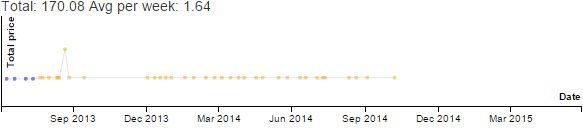
Large eggs
The price of large eggs is stable at $4.27 for 18. We use ~11 eggs a week.
Things we buy when they’re on sale
Canned tomatoes
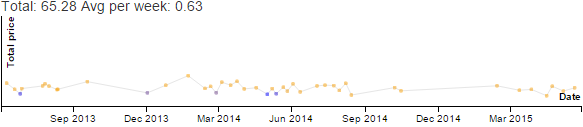
We stock up on canned tomatoes when they go on sale, since they’re easy to store.
We probably use ~3 cans a month. The sale price has drifted up from $0.88 to $0.97, while the regular price is a little bit over $1.50.
Butter
We haven’t bought butter at full-price in two years. The sale price for unsalted butter tends to be between $2.77 and $3.33, while the regular price is $6+.
Produce
Strawberries
I like strawberries, but I stopped buying them for a long time because they seemed like such an indulgence and the sweetness tended to be hit-or-miss. This year, I gave myself permission to splurge on strawberries in season.
Bananas
We seem to go through banana phases. When we hit banana overload, we stop for a while.
The colours here are just due to floating point imprecision. Bananas have actually stayed the same price for the past two years ($1.26/kg).
Apples
We often get gala apples:
We like picking up ambrosia apples during the rare occasions they’re available. Last winter was a good one for ambrosia apple availability.
Chicken
Whole chickens
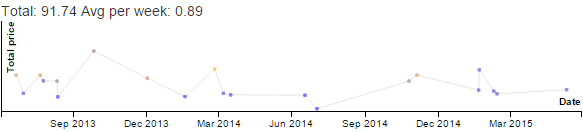
Lots of whole chickens lately, because of the rotisserie.
Chicken quarters
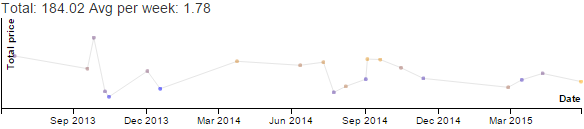
Our main protein, although we also buy a fair bit of beef and pork, and chicken drumsticks/thighs when they’re on sale.
There’s more I haven’t explored yet, but I figured I’d put together these little observations along the way. =)


