Preparing presentations: from mindmap to storyboard
| presentation, sketches, web2.0The way I prepare presentations has changed quite a lot since I started speaking in public in 2002. (Wow, it’s been six years!) I was preparing a presentation for Concordia University students on Web 2.0 at work, and I figured that it’s gotten to the point where I can actually explain to other people how I do it. In the process, I’m sure we’ll figure out ways to do things even better. =) Here’s what I did:
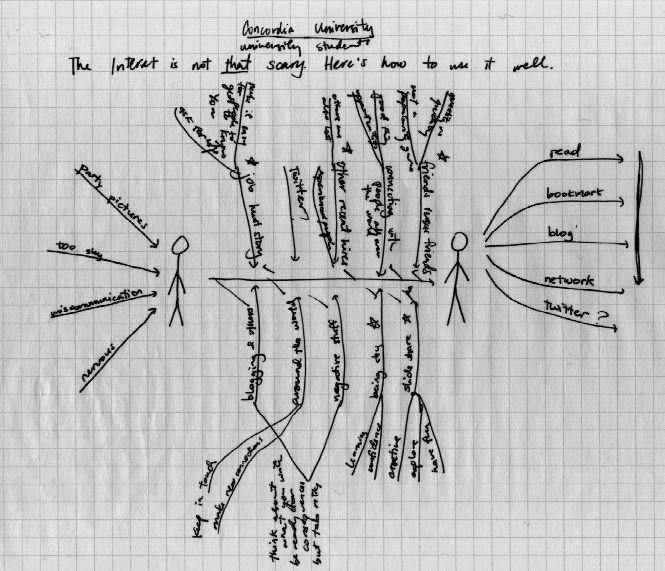
I started by writing some details about the talk along the top of the page: where it is and who’s attending. Then I drew two stick figures: one for people going into the talk, and one for people going out of the talk.
I focused on the people going out of the talk. What did I want them to be able to do? What did I want them to understand? What did I want them to feel?
After I sketched the outcome, I went to the beginning. What would people be thinking, going in? What would be their experiences and assumptions?
Then I drew an arrow from the person going in to the person going out. Somehow, my presentation would need to help people get from point A to point B.
I added lots of arrows feeding into that main arrow. Which stories could help people move towards the outcome? I listed as many stories as I could.
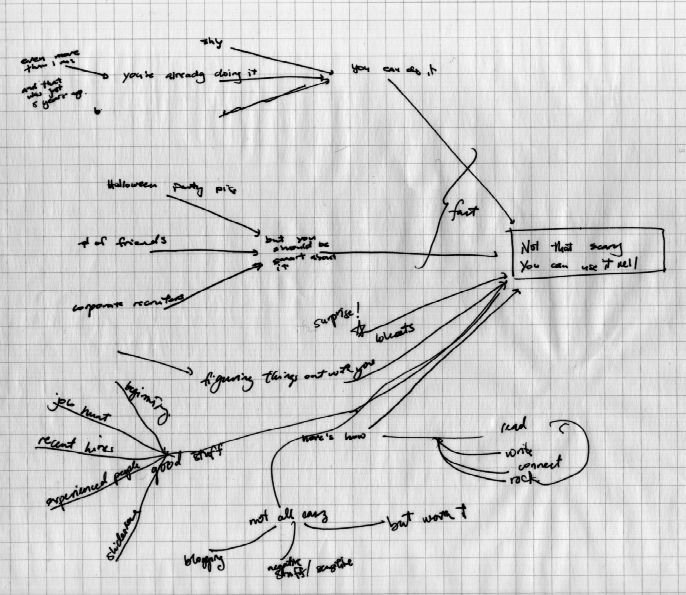
Then I started mindmapping the presentation so that I could group similar elements and flesh things out in more detail. I wrote my key message on the right side. Then I broke it down into parts, which I refined further. I cross-referenced it against the first page to see if I had any other stories that fit in nicely, and to make sure that all the parts I wanted to include were related to the arrow between point A and point B.
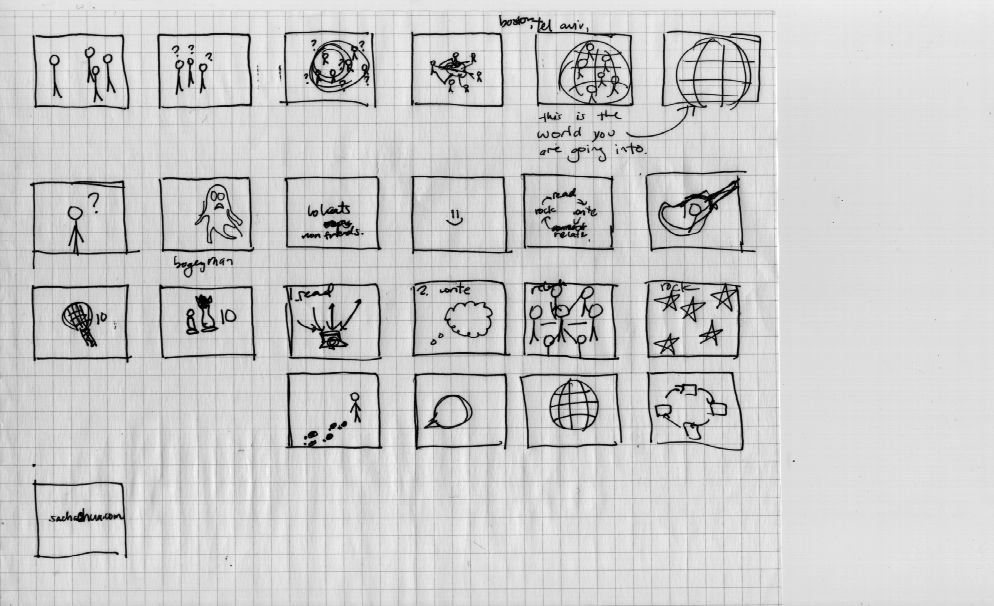
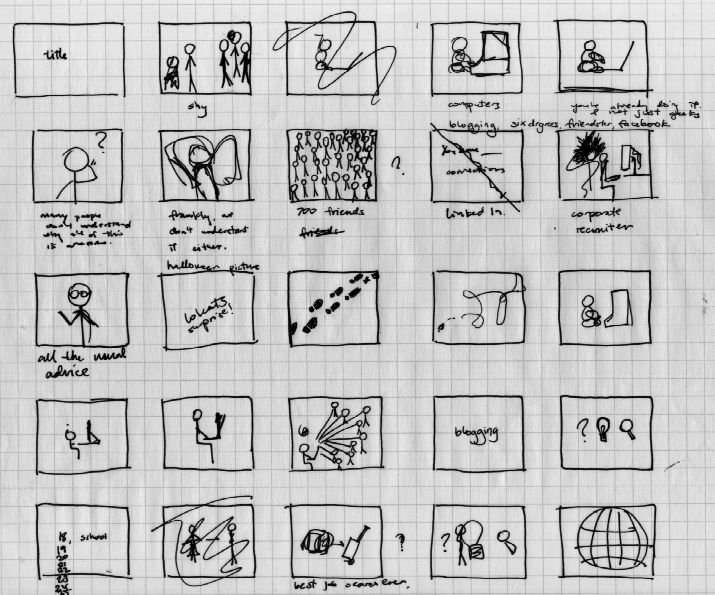
 And then it was storyboard time! =D I didn’t have any storyboard templates lying around (maybe I should print some!), so I used graphing paper instead. I could’ve used my Cintiq for this and the previous steps, but graphing paper had been more convenient when I started, and it didn’t cost me that much more time. =)
It was strange making a storyboard for the presentation. I’d hear snippets of the presentation in my head – sudden snatches of potential transitions and ways to illustrate topics. I started from the first slide and followed the images as they flowed. There are better ways to illustrate these things, I’m sure, but this was a good start! =)
After I created the storyboard, I opened up Inkscape and brought out my Cintiq tablet. I made a grid of 800 pixel by 600 pixel rectangles, 5 rectangles across and 9 rectangles down. I set the rectangle fills to black and my pencil color to white, and then I started drawing. I occasionally cleaned things up with the node tool and the delete button, both mapped to shortcut keys on my tablet.
A couple of hours later, it was done.
Then I needed to figure out how to get it into a presentation. I didn’t want to export each frame, because it was hard to keep things in sequence and inconvenient to rearrange slides in the presentation software. Instead, I exported the entire thing as a large image. I used ImageMagick (convert -crop 800x600 slides.png slide_%d.png) to slice the image into tiles, and the OpenOffice.org Photo Album extension to import all of the slides. Bonus: they imported in sequence!
I saved the slides as ODP and PPT, and exported the slides as PDF. Et voila:
The slides don’t make sense without me, but that’s okay. =) I may make a standalone version if it works out.


4 comments
Rob Watson
2008-11-12T12:48:42ZGreat post!
I discovered it through one of those happy little accidents in life - I have a Google Alert set up for anything on presenting. It's never shown your blog on there before, but I was intrigued by your title and the post totally lived up to it! I have now subscribed to it through Google Reader.
I take a similar approach myself, but your "stick people and arrows" thing is new to me - I love it!
Keep up the great work!
Rob
Vic toria
2008-12-06T20:10:57ZGreat post.... My name is Victoria, i´m from Buenos Aires, Argentina and a daily reader of your blog....
I really like this post because it is going to make me easier to prepare a presentation i have to make in february. it really help me (you dont know how much) to get in order the ideas on how to make and how to prepare it. thank you so much....
im really scare specially because th presentation is for people older than me.....
a short question... this presentation you prepare.... how long it is in time....?
sorry for my poor english....
keep on wrting....
thanks,,,,,,
Nelson Wilfrido Vargas Coloma
2008-12-31T01:45:47ZHello my name is Nelson, I'm from Ecuador in Latin America.
Congratulations your work in the "World's Best Presentation Contest 2008" I am very happy to secondary and university professor
Merry Christmas and Happy New Year
rachel
2009-01-20T04:32:51ZGlad i clicked your twitter update about ROI for public speaking and I ended up here. I'll be presenting this February and up until now I have not organized my ideas yet. I'll try your approach on this, it might help me a lot.
cheers,
rachel