Quantified Self: Analyzing 32 months of clothing data
Posted: - Modified: | quantifiedI added the ability to analyze clothing use by week, month, or year to Quantified Awesome, where I've been tracking my clothes since August 2011. With a little bit of Microsoft Excel formatting, here's part of the analysis I get:
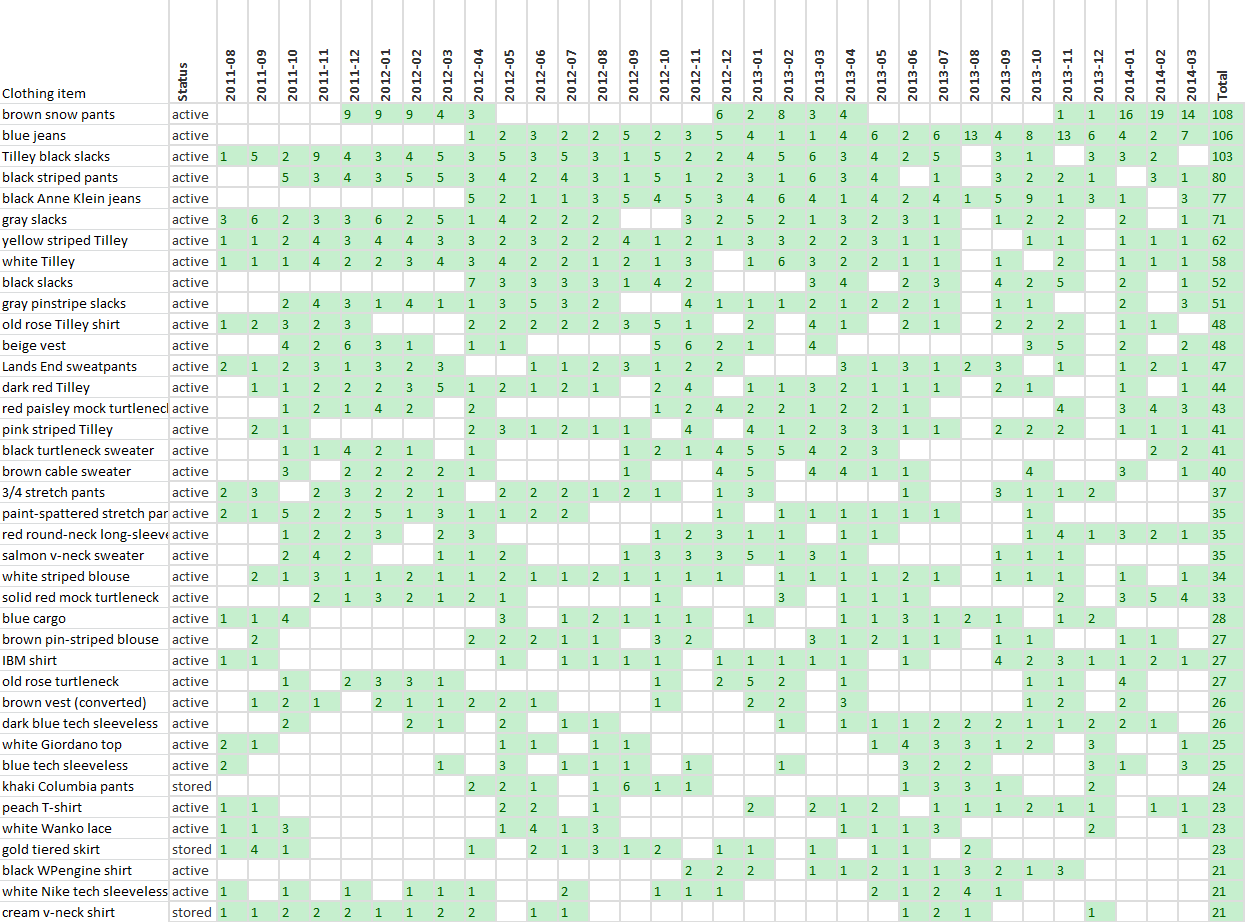
(more rows omitted)
You can see how I've practically been living in snow pants this past winter, which has been very cold. Unsurprisingly, I don't wear it at all during warmer months. Sweaters and long-sleeved tops are bursty too, naturally. I bought my two pairs of jeans from a thrift store in April 2012 and have been wearing them fairly regularly since. I also wear my office slacks a lot, since I have fewer of them compared to tops.
Nothing particularly unintuitive about this data, but it's interesting to see. One of the later rows reminds me, hey, where did my black WPengine shirt go? That was comfy, but I haven't worn it in 4 months – it might have disappeared into J-‘s closet. Now that we're almost the same size, sometimes things get misfiled. Also, might be time to donate more clothes…