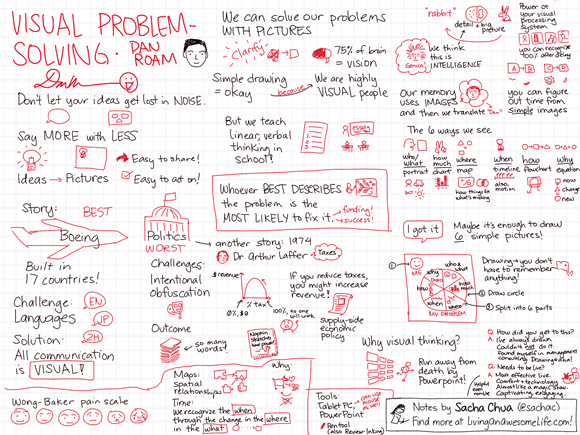
Sketchnotes: Visual Problem-solving–Dan Roam (DAN ROAM!)
Posted: - Modified: | drawing, sketchnotesDan Roam (Back of the Napkin; Blah, Blah, Blah) was in Toronto yesterday to give a talk on visual problem-solving at the Rotman School of Management. I like to think that I was cool and composed during the post-talk book-signing, but really, the only reason I didn’t get a picture with him was because I was too busy trying to not hyperventilate about the fact that he recognized me from Twitter and said he liked my work. =)
I did ask him to sign this sketchnote, though. 
“Whoever best describes the problem is the most likely to fix it.” That reminds me of SPI 046: Building a Lucrative Business with No Ideas, No Expertise & No Money with Dane Maxwell, a Smart Passive Income podcast that dove deeper into defining problems and building businesses around them. Nugget from that one: “If you can define the problem better than your target customer, then they will assume you have the solution.”
Check out my other sketchnotes for one-page summaries of business and technology talks. Look at Rotman’s upcoming events calendar for other cool speakers!
Text from the sketchnote, to simplify searching:
Whoever best describes the problem is the most likely to fix it.
Say more with less: ideas -> pictures (easy to share, easy to act on)
Stories:
- Best – Boeing: built in 17 countries; challenge: languages; solution: all communication is visual
- Worst – Politics: challenges: intentional obfuscation, outcome is so many words
- 1974 Dr. Arthur Laffer – taxes; If you reduce taxes, you might increase revenue. Napkin sketch.
We can solve our problems with pictures. Simple drawing is okay. 75% of brain = vision. We are highly visual people. But we teach linear, verbal thinking in school!
detail + big picture. We think detail is intelligence. Power on your visual operating system. You can recognize ~100% after delay. You can figure out time from simple images. Our memory uses images and then we translate
The six ways we see:
- who/what: portrait
- how much: chart
- where: map (how things fit, what’s missing)
- when: timeline; also, motion
- how: flowchart
- why: equation (now + change = new)
Maybe it’s enough to draw 6 simple pictures
Drawing – you don’t have to remember anything!
Why visual thinking? Run away from death by Powerpoint.
Tools: Tablet PC (can use mouse as well), PowerPoint – pen tool
Wong-Baker pain scale; maps: spatial relationships; time: we recognize the when through the change in the where in the what.

2 comments
Aurélien
2012-12-11T18:49:07ZI love your notes. Interesting and just beautiful to look at :)
Sacha Chua
2012-12-11T21:08:41ZI'm glad you like them! =)
Also, Emacs is awesome. =D