Getting R and ggplot2 to work in Emacs Org Mode Babel blocks; also, tracking the number of TODOs
Posted: - Modified: | emacs, org, quantifiedI started tracking the number of tasks I had in Org Mode so that I could find out if my TODO list tended to shrink or grow. It was easy to write a function in Emacs Lisp to count the number of tasks in different states and summarize them in a table.
(defun sacha/org-count-tasks-by-status ()
  (interactive)
  (let ((counts (make-hash-table :test 'equal))
        (today (format-time-string "%Y-%m-%d" (current-time)))
        values output)
    (org-map-entries
     (lambda ()
       (let* ((status (elt (org-heading-components) 2)))
         (when status
           (puthash status (1+ (or (gethash status counts) 0)) counts))))
     nil
     'agenda)
    (setq values (mapcar (lambda (x)
                           (or (gethash x counts) 0))
                         '("DONE" "STARTED" "TODO" "WAITING" "DELEGATED" "CANCELLED" "SOMEDAY")))
    (setq output
          (concat "| " today " | "
                  (mapconcat 'number-to-string values " | ")
                  " | "
                  (number-to-string (apply '+ values))
                  " | "
                  (number-to-string
                   (round (/ (* 100.0 (car values)) (apply '+ values))))
                  "% |"))
    (if (called-interactively-p 'any)
        (insert output)
      output)))
(sacha/org-count-tasks-by-status)
I ran this code over several days. Here are my results as of 2014-05-01:
| Date | DONE | START. | TODO | WAIT. | DELEG. | CANC. | SOMEDAY | Total | % done | + done | +canc. | + total | + t – d – c | Note |
|---|---|---|---|---|---|---|---|---|---|---|---|---|---|---|
| 2014-04-16 | 1104 | 1 | 403 | 3 | 1 | 104 | 35 | 1651 | 67% | |||||
| 2014-04-17 | 1257 | 0 | 114 | 4 | 1 | 171 | 107 | 1654 | 76% | 153 | 67 | 3 | -217 | Lots of trimming |
| 2014-04-18 | 1292 | 0 | 74 | 4 | 5 | 183 | 100 | 1658 | 78% | 35 | 12 | 4 | -43 | A little bit more trimming |
| 2014-04-20 | 1305 | 0 | 80 | 4 | 5 | 183 | 100 | 1677 | 78% | 13 | 0 | 19 | 6 | |
| 2014-04-21 | 1311 | 1 | 78 | 4 | 4 | 184 | 99 | 1681 | 78% | 6 | 1 | 4 | -3 | |
| 2014-04-22 | 1313 | 2 | 75 | 4 | 4 | 184 | 99 | 1681 | 78% | 2 | 0 | 0 | -2 | |
| 2014-04-23 | 1369 | 4 | 66 | 4 | 5 | 186 | 101 | 1735 | 79% | 56 | 2 | 54 | -4 | Added sharing/index.org |
| 2014-04-24 | 1371 | 3 | 69 | 4 | 5 | 186 | 101 | 1739 | 79% | 2 | 0 | 4 | 2 | |
| 2014-04-25 | 1379 | 3 | 60 | 3 | 5 | 189 | 103 | 1742 | 79% | 8 | 3 | 3 | -8 | |
| 2014-04-26 | 1384 | 3 | 65 | 3 | 5 | 192 | 103 | 1755 | 79% | 5 | 3 | 13 | 5 | |
| 2014-04-27 | 1389 | 2 | 66 | 3 | 5 | 192 | 103 | 1760 | 79% | 5 | 0 | 5 | 0 | |
| 2014-04-28 | 1396 | 3 | 67 | 3 | 5 | 192 | 103 | 1769 | 79% | 7 | 0 | 9 | 2 | |
| 2014-04-29 | 1396 | 3 | 67 | 3 | 5 | 192 | 103 | 1769 | 79% | 0 | 0 | 0 | 0 | |
| 2014-04-30 | 1404 | 4 | 70 | 4 | 5 | 192 | 103 | 1782 | 79% | 8 | 0 | 13 | 5 | |
| 2014-05-01 | 1413 | 4 | 80 | 3 | 4 | 193 | 103 | 1800 | 79% | 9 | 1 | 18 | 8 |
Here's the source for that table:
| Date | DONE | START. | TODO | WAIT. | DELEG. | CANC. | SOMEDAY | Total | % done | + done | +canc. | + total | + t - d - c | Note | |------------+------+--------+------+-------+--------+-------+---------+-------+--------+--------+--------+---------+-------------+----------------------------| | 2014-04-16 | 1104 | 1 | 403 | 3 | 1 | 104 | 35 | 1651 | 67% | | | | | | | 2014-04-17 | 1257 | 0 | 114 | 4 | 1 | 171 | 107 | 1654 | 76% | 153 | 67 | 3 | -217 | Lots of trimming | | 2014-04-18 | 1292 | 0 | 74 | 4 | 5 | 183 | 100 | 1658 | 78% | 35 | 12 | 4 | -43 | A little bit more trimming | | 2014-04-20 | 1305 | 0 | 80 | 4 | 5 | 183 | 100 | 1677 | 78% | 13 | 0 | 19 | 6 | | | 2014-04-21 | 1311 | 1 | 78 | 4 | 4 | 184 | 99 | 1681 | 78% | 6 | 1 | 4 | -3 | | | 2014-04-22 | 1313 | 2 | 75 | 4 | 4 | 184 | 99 | 1681 | 78% | 2 | 0 | 0 | -2 | | | 2014-04-23 | 1369 | 4 | 66 | 4 | 5 | 186 | 101 | 1735 | 79% | 56 | 2 | 54 | -4 | Added sharing/index.org | | 2014-04-24 | 1371 | 3 | 69 | 4 | 5 | 186 | 101 | 1739 | 79% | 2 | 0 | 4 | 2 | | | 2014-04-25 | 1379 | 3 | 60 | 3 | 5 | 189 | 103 | 1742 | 79% | 8 | 3 | 3 | -8 | | | 2014-04-26 | 1384 | 3 | 65 | 3 | 5 | 192 | 103 | 1755 | 79% | 5 | 3 | 13 | 5 | | | 2014-04-27 | 1389 | 2 | 66 | 3 | 5 | 192 | 103 | 1760 | 79% | 5 | 0 | 5 | 0 | | | 2014-04-28 | 1396 | 3 | 67 | 3 | 5 | 192 | 103 | 1769 | 79% | 7 | 0 | 9 | 2 | | | 2014-04-29 | 1396 | 3 | 67 | 3 | 5 | 192 | 103 | 1769 | 79% | 0 | 0 | 0 | 0 | | | 2014-04-30 | 1404 | 4 | 70 | 4 | 5 | 192 | 103 | 1782 | 79% | 8 | 0 | 13 | 5 | | | 2014-05-01 | 1413 | 4 | 80 | 3 | 4 | 193 | 103 | 1800 | 79% | 9 | 1 | 18 | 8 | |
I wanted to graph this with Gnuplot, but it turns out that Gnuplot is difficult to integrate with Emacs on Microsoft Windows. I gave up after a half an hour of poking at it, since search results indicated there were long-standing problems with how Gnuplot got input from Emacs. Besides, I'd been meaning to learn more R anyway, and R is more powerful when it comes to statistics and data visualization.
Getting R to work with Org Mode babel blocks in Emacs on Windows was a challenge. Here are some of the things I ran into.
The first step was easy: Add R to the list of languages I could evaluate in a source block (I already had dot and ditaa from previous experiments).
(org-babel-do-load-languages
 'org-babel-load-languages
 '((dot . t)
   (ditaa . t)
   (R . t)))
But my code didn't execute at all, even when I was trying something that printed out results instead of drawing images. I got a little lost trying to dig into org-babel-execute:R with edebug, eventually ending up in comint.el. The real solution was even easier. I had incorrectly set inferior-R-program-name to the path of R in my configuration, which made M-x R work but which meant that Emacs was looking in the wrong place for the options to pass to R (which Org Babel relied on). The correct way to do this is to leave inferior-R-program-name with the default value (Rterm) and make sure that my system path included both the bin directory and the bin\x64 directory.
Then I had to pick up the basics of R again. It took me a little time to figure out that I needed to parse the columns I pulled in from Org, using strptime to convert the date column and as.numeric to convert the numbers. Eventually, I got it to plot some results with the regular plot command.
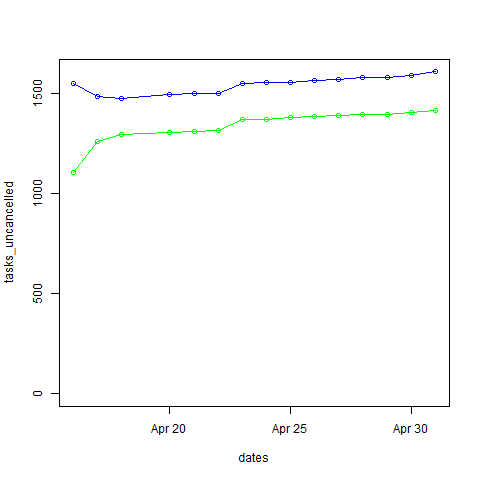
dates <- strptime(as.character(data$Date), "%Y-%m-%d")
tasks_done <- as.numeric(data$DONE)
tasks_uncancelled <- as.numeric(data$Total) - as.numeric(data$CANC.)
df <- data.frame(dates, tasks_done, tasks_uncancelled)
plot(x=dates, y=tasks_uncancelled, ylim=c(0,max(tasks_uncancelled)))
lines(x=dates, y=tasks_uncancelled, col="blue", type="o")
lines(x=dates, y=tasks_done, col="green", type="o")
I wanted prettier graphs, though. I installed the ggplot2 package and started figuring it out. No matter what I did, though, I ended up with a blank white image instead of my graph. If I used M-x R instead of evaluating the src block, the code worked. Weird! Eventually I found out that adding print(...) around my ggplot made it display the image correctly. Yay! Now I had what I wanted.
library(ggplot2)
dates <- strptime(as.character(data$Date), "%Y-%m-%d")
tasks_done <- as.numeric(data$DONE)
tasks_uncancelled <- as.numeric(data$Total) - as.numeric(data$CANC.)
df <- data.frame(dates, tasks_done, tasks_uncancelled)
plot = ggplot(data=df, aes(x=dates, y=tasks_done, ymin=0)) + geom_line(color="#009900") + geom_point() + geom_line(aes(y=tasks_uncancelled), color="blue") + geom_point(aes(y=tasks_uncancelled))
print(plot)
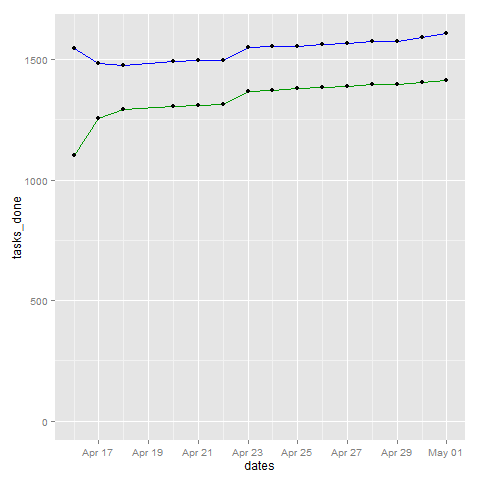
The blue line represents the total number of tasks (except for the cancelled ones), and the green line represents tasks that are done.
Here's something that looks a little more like a burn down chart, since it shows just the number of things to be done:
library(ggplot2)
dates <- strptime(as.character(data$Date), "%Y-%m-%d")
tasks_remaining <- as.numeric(data$Total) - as.numeric(data$CANC.) - as.numeric(data$DONE)
df <- data.frame(dates, tasks_remaining)
plot = ggplot(data=df, aes(x=dates, y=tasks_remaining, ymin=0)) + geom_line(color="#009900") + geom_point()
print(plot)
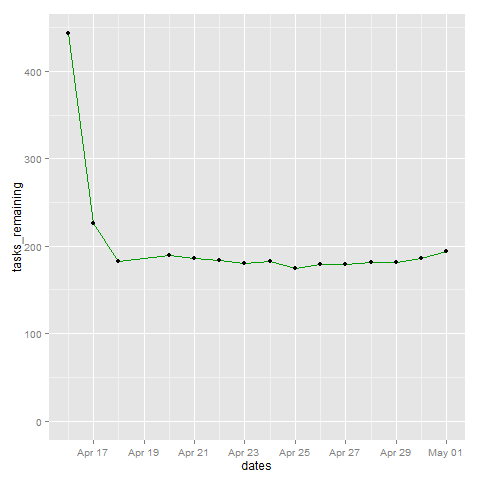
The drastic decline there is me realizing that I had lots of tasks that were no longer relevant, not me being super-productive. =)
As it turns out, I tend to add new tasks at about the rate that I finish them (or slightly more). I think this is okay. It means I'm working on things that have next steps, and next steps, and steps beyond that. If I add more tasks, that gives me more variety to choose from. Besides, I have a lot of repetitive tasks, so those never get marked as DONE over here.
Anyway, cool! Now that I've gotten R to work on my system, you'll probably see it in even more of these blog posts. =D Hooray for Org Babel and R!
9 comments
Paul D
2014-05-02T23:17:41Z"It was easy to write a function..."
Yes... it *looks* easy :-)
sachac
2014-05-03T01:37:26Z<laugh> Okay... To be fair, I'd used org-map-entries quite a few times before. =) I had to look up hashes, though!
edkademan
2014-05-04T01:53:35ZThe point of your post was to describe how R works with org mode so in
some sense what I have to say is a little off topic, but I can't
resist pointing out that calls to ggplot can be very simple if only
the dataframe is whipped into shape beforehand.
The code below does something very similar to what you are doing but
only considering the R side of things and only with toy data.
#+BEGIN_SRC R
require(reshape2)
require(ggplot2)
df0 <- data.frame(dates = seq(from = as.POSIXct("2014-4-1"),
to = as.POSIXct("2014-4-5"),
by = "day"),
tasks_done = c(100, 120, 150, 155, 160),
tasks_uncancelled = c( 90, 105, 110, 150, 155))
df <- melt(df0, id.vars = "dates")
ggplot(df) + geom_line(aes(dates, value, color = variable))
#+END_SRC
The call to data.frame assembles the data in a way that is maybe most
natural to think about:
#+BEGIN_EXAMPLE
R> df0
dates tasks_done tasks_uncancelled
1 2014-04-01 100 90
2 2014-04-02 120 105
3 2014-04-03 150 110
4 2014-04-04 155 150
5 2014-04-05 160 155
R>
#+END_EXAMPLE
and melt unwinds them so that ggplot can break them out without our
having to make multiple calls to geom_line:
#+BEGIN_EXAMPLE
R> df
dates variable value
1 2014-04-01 tasks_done 100
2 2014-04-02 tasks_done 120
3 2014-04-03 tasks_done 150
4 2014-04-04 tasks_done 155
5 2014-04-05 tasks_done 160
6 2014-04-01 tasks_uncancelled 90
7 2014-04-02 tasks_uncancelled 105
8 2014-04-03 tasks_uncancelled 110
9 2014-04-04 tasks_uncancelled 150
10 2014-04-05 tasks_uncancelled 155
R>
#+END_EXAMPLE
In the call to geom_line, associating the color aesthetic with the
column "variable" insures that each unique value in that column
defines its own colored line.
The nice thing about the code above is that it automatically gives you
a legend. With a little more work you can add the points as well, and
you can control things like labels and titles and precisely which
colors go with which type of task.
sachac
2014-05-05T19:55:43ZAwesome! I'm an R newbie, so style notes are very much welcome. =) I didn't know about melt!
Grant Rettke
2014-05-05T17:27:12ZGreat post.
sachac
2014-05-05T19:55:59ZGlad you like it. What would you like to read more about? =)
Grant Rettke
2014-05-05T21:45:25ZHow to integrate the wisdom that you've acquired from studying and applying technologies and science into your own personal creative process, into one's own personal creative process Additionally a study or review of personal creative processes that humans have used successfully before the addition of electronic machinery and science into our culture.
dmg
2014-05-05T23:23:19ZSacha,
to avoid repetition in your R you can use the noweb. For example:
#+name: readData
#+begin_src R :results output :exports both :cache yes :noweb yes
library(gmodels)
require(vcd)
require(vcdExtra)
original<-read.table("devsurvey.transcoded",header=TRUE,sep=';',na.strings = "")
original=na.omit(original)
original$age<-as.factor(original$age)
....
#+end_src
#+begin_src R :results output :exports both :cache no :noweb yes
<<readdata>>
summary(original)
#+end_src
晓风东东
2020-01-16T07:14:43ZTrue Geek!!! really like your post!!