Digraphs with Graphviz
| visualization, geekAnd for the geeks, here’s the Graphviz dot file that created the graph in How to do a lot. Posting here because I know I’m going to forget, and also because it’s so cool…
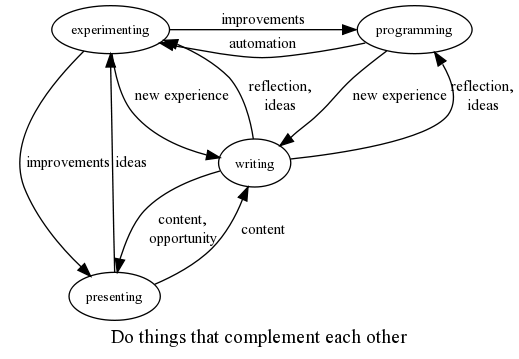
digraph {
  label = "Do things that complement each other";
  subgraph {
    rank=same
    experimenting
    programming
  }
  writing
  presenting
  programming -> writing  [label="new experience"]
  experimenting -> writing [label="new experience"]
  programming -> experimenting [label="automation"]
  experimenting -> programming [label="improvements"]
  writing -> presenting [label="content,\nopportunity"]
  presenting -> writing [label="content"]
  writing -> programming [label="reflection,\nideas"]
  writing -> experimenting [label="reflection,\nideas"]
  presenting -> experimenting [label="ideas"]
  experimenting -> presenting [label="improvements"]
}
I created it with the command:
dot -Nfontsize=10 -Efontsize=11 FILENAME -o OUTPUTFILENAME -Tpng
The result:
You can e-mail me at sacha@sachachua.com.