#EmacsConf backstage: looking at EmacsConf's growth over 5 years, and how to do pivot tables and graphs with Org Mode and the Python pandas library
| emacsconf, emacs, org, pythonHaving helped organize EmacsConf for a number of years now, I know that I usually panic about whether we have submissions partway through the call for participation. This causes us to extend the CFP deadline and ask people to ask more people to submit things, and then we end up with a wonderful deluge of talks that I then have to somehow squeeze into a reasonable-looking schedule.
This year, I managed to not panic and I also resisted the urge to extend the
CFP deadline, trusting that there will actually be tons of cool stuff.
It helped that my schedule SVG code let me visualize what the
conference could feel like with the submissions so far, so we started
with a reasonably nice one-track conference and built up from there.
It also helped that I'd gone back to the submissions for 2022 and
plotted them by the number of weeks before the CFP deadline, and I
knew that there'd be a big spike from all those people whose Org
DEADLINE: properties would nudge them into finalizing their
proposals.
Out of curiosity, I wanted to see how the stats for this year compared with previous years. I wrote a small function to collect the data that I wanted to summarize:
emacsconf-count-submissions-by-week: Count submissions in INFO by distance to CFP-DEADLINE.
(defun emacsconf-count-submissions-by-week (&optional info cfp-deadline)
  "Count submissions in INFO by distance to CFP-DEADLINE."
  (setq cfp-deadline (or cfp-deadline emacsconf-cfp-deadline))
  (setq info (or info (emacsconf-get-talk-info)))
  (cons '("Weeks to CFP end date" "Count" "Hours")
        (mapcar (lambda (entry)
                  (list (car entry)
                        (length (cdr entry))
                        (apply '+ (mapcar 'cdr (cdr entry)))))
                (seq-group-by
                 'car
                 (sort
                  (seq-keep
                   (lambda (o)
                     (and (emacsconf-publish-talk-p o)
                          (plist-get o :date-submitted)
                          (cons (floor (/ (days-between (plist-get o :date-submitted) cfp-deadline)
                                          7.0))
                                (string-to-number
                                 (or (plist-get o :video-duration)
                                     (plist-get o :time)
                                     "0")))))
                   info)
                  (lambda (a b) (< (car a) (car b))))))))
and then I ran it against the different files for each year, filling in the previous years' data as needed. The resulting table is pretty long, so I've put that in a collapsible section.
(let ((years `((2023 "~/proj/emacsconf/2023/private/conf.org" "2023-09-15")
               (2022 "~/proj/emacsconf/2022/private/conf.org" "2022-09-18")
               (2021 "~/proj/emacsconf/2021/private/conf.org" "2021-09-30")
               (2020 "~/proj/emacsconf/wiki/2020/submissions.org" "2020-09-30")
               (2019 "~/proj/emacsconf/2019/private/conf.org" "2019-08-31"))))
  (append
   '(("Weeks to CFP" "Year" "Count" "Minutes"))
   (seq-mapcat
    (lambda (year-info)
      (let ((emacsconf-org-file (elt year-info 1))
            (emacsconf-cfp-deadline (elt year-info 2))
            (year (car year-info)))
        (mapcar (lambda (o) (list (car o) year (cadr o) (elt o 2)))
                (cdr (emacsconf-count-submissions-by-week (emacsconf-get-talk-info) emacsconf-cfp-deadline)))))
    years)))
Table
| Weeks to CFP | Year | Count | Minutes |
| -12 | 2023 | 4 | 70 |
| -9 | 2023 | 2 | 30 |
| -7 | 2023 | 2 | 30 |
| -5 | 2023 | 2 | 30 |
| -4 | 2023 | 2 | 60 |
| -3 | 2023 | 3 | 40 |
| -2 | 2023 | 5 | 130 |
| -1 | 2023 | 10 | 180 |
| 0 | 2023 | 8 | 140 |
| 1 | 2023 | 1 | 20 |
| -8 | 2022 | 2 | 25 |
| -5 | 2022 | 2 | 31 |
| -3 | 2022 | 2 | 31 |
| -2 | 2022 | 2 | 17 |
| -1 | 2022 | 8 | 191 |
| 0 | 2022 | 8 | 110 |
| 1 | 2022 | 5 | 107 |
| -8 | 2021 | 4 | 50 |
| -7 | 2021 | 2 | 17 |
| -6 | 2021 | 1 | 7 |
| -5 | 2021 | 2 | 22 |
| -4 | 2021 | 2 | 19 |
| -3 | 2021 | 5 | 73 |
| -2 | 2021 | 1 | 10 |
| -1 | 2021 | 12 | 163 |
| 0 | 2021 | 13 | 197 |
| 1 | 2021 | 1 | 10 |
| 2 | 2021 | 1 | 10 |
| -5 | 2020 | 1 | 10 |
| -4 | 2020 | 1 | 15 |
| -2 | 2020 | 1 | 30 |
| -1 | 2020 | 4 | 68 |
| 0 | 2020 | 21 | 424 |
| 1 | 2020 | 7 | 152 |
| -5 | 2019 | 2 | 45 |
| -4 | 2019 | 1 | 21 |
| -2 | 2019 | 6 | 126 |
| -1 | 2019 | 9 | 82 |
| 0 | 2019 | 9 | 148 |
| 2 | 2019 | 1 | 7 |
Some talks were proposed off-list and are not captured here, and cancelled or withdrawn talks weren't included either. The times for previous years use the actual video time, and the times for this year use proposed times.
Off the top of my head, I didn't know of an easy way to make a pivot
table or cross-tab using just Org Mode or Emacs Lisp. I tried using
datamash, but I was having a hard time getting my output just the way
I wanted it. Fortunately, it was super-easy to get my data from an Org
table into Python so I could use pandas.pivot_table. Because I had
used #+NAME: submissions-by-week to label the table, I could use
:var data=submissions-by-week to refer to the data in my Python
program. Then I could summarize them by week.
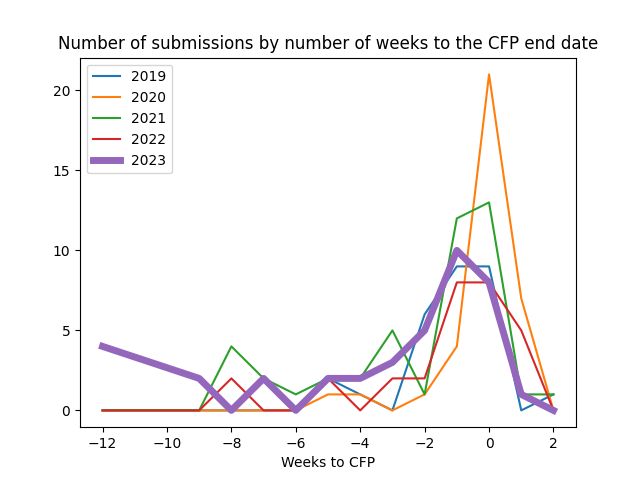
Here's the number of submissions by the number of weeks to the original CFP deadline, so we can see people generally like to target the CFP date.
import pandas as pd
import matplotlib.pyplot as plt
df = pd.DataFrame(data[1:], columns=data[0])
df = pd.pivot_table(df, columns=['Year'], index=['Weeks to CFP'], values='Count', aggfunc='sum', fill_value=0).iloc[::-1].sort_index(ascending=True)
fig, ax = plt.subplots()
figure = df.plot(title='Number of submissions by number of weeks to the CFP end date', ax=ax)
for line in ax.get_lines():
    if line.get_label() == '2023':
        line.set_linewidth(5)
for line in plt.legend().get_lines():
    if line.get_label() == '2023':
        line.set_linewidth(5)
figure.get_figure().savefig('number-of-submissions.png')
return df
| Weeks to CFP | 2019 | 2020 | 2021 | 2022 | 2023 |
|---|---|---|---|---|---|
| -12 | 0 | 0 | 0 | 0 | 4 |
| -9 | 0 | 0 | 0 | 0 | 2 |
| -8 | 0 | 0 | 4 | 2 | 0 |
| -7 | 0 | 0 | 2 | 0 | 2 |
| -6 | 0 | 0 | 1 | 0 | 0 |
| -5 | 2 | 1 | 2 | 2 | 2 |
| -4 | 1 | 1 | 2 | 0 | 2 |
| -3 | 0 | 0 | 5 | 2 | 3 |
| -2 | 6 | 1 | 1 | 2 | 5 |
| -1 | 9 | 4 | 12 | 8 | 10 |
| 0 | 9 | 21 | 13 | 8 | 8 |
| 1 | 0 | 7 | 1 | 5 | 1 |
| 2 | 1 | 0 | 1 | 0 | 0 |
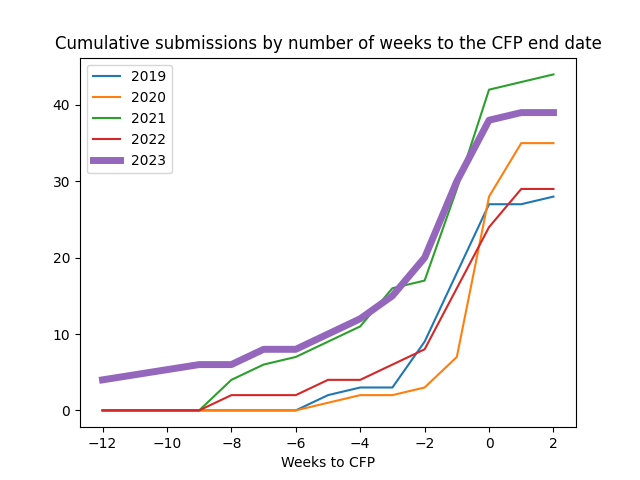
Calculating the cumulative number of submissions might be more useful. Here, each row shows the number received so far.
import pandas as pd
import matplotlib.pyplot as plt
df = pd.DataFrame(data[1:], columns=data[0])
df = pd.pivot_table(df, columns=['Year'], index=['Weeks to CFP'], values='Count', aggfunc='sum', fill_value=0).iloc[::-1].sort_index(ascending=True).cumsum()
fig, ax = plt.subplots()
figure = df.plot(title='Cumulative submissions by number of weeks to the CFP end date', ax=ax)
for line in ax.get_lines():
    if line.get_label() == '2023':
        line.set_linewidth(5)
for line in plt.legend().get_lines():
    if line.get_label() == '2023':
        line.set_linewidth(5)
figure.get_figure().savefig('cumulative-submissions.png')
return df
| Weeks to CFP | 2019 | 2020 | 2021 | 2022 | 2023 |
|---|---|---|---|---|---|
| -12 | 0 | 0 | 0 | 0 | 4 |
| -9 | 0 | 0 | 0 | 0 | 6 |
| -8 | 0 | 0 | 4 | 2 | 6 |
| -7 | 0 | 0 | 6 | 2 | 8 |
| -6 | 0 | 0 | 7 | 2 | 8 |
| -5 | 2 | 1 | 9 | 4 | 10 |
| -4 | 3 | 2 | 11 | 4 | 12 |
| -3 | 3 | 2 | 16 | 6 | 15 |
| -2 | 9 | 3 | 17 | 8 | 20 |
| -1 | 18 | 7 | 29 | 16 | 30 |
| 0 | 27 | 28 | 42 | 24 | 38 |
| 1 | 27 | 35 | 43 | 29 | 39 |
| 2 | 28 | 35 | 44 | 29 | 39 |
And here's the cumulative number of minutes based on the proposals.
import pandas as pd
import matplotlib.pyplot as plt
df = pd.DataFrame(data[1:], columns=data[0])
df = pd.pivot_table(df, columns=['Year'], index=['Weeks to CFP'], values='Minutes', aggfunc='sum', fill_value=0).iloc[::-1].sort_index(ascending=True).cumsum()
fig, ax = plt.subplots()
figure = df.plot(title='Cumulative minutes by number of weeks to the CFP end date', ax=ax)
for line in ax.get_lines():
    if line.get_label() == '2023':
        line.set_linewidth(5)
for line in plt.legend().get_lines():
    if line.get_label() == '2023':
        line.set_linewidth(5)
figure.get_figure().savefig('cumulative-minutes.png')
return df
| Weeks to CFP | 2019 | 2020 | 2021 | 2022 | 2023 |
|---|---|---|---|---|---|
| -12 | 0 | 0 | 0 | 0 | 70 |
| -9 | 0 | 0 | 0 | 0 | 100 |
| -8 | 0 | 0 | 50 | 25 | 100 |
| -7 | 0 | 0 | 67 | 25 | 130 |
| -6 | 0 | 0 | 74 | 25 | 130 |
| -5 | 45 | 10 | 96 | 56 | 160 |
| -4 | 66 | 25 | 115 | 56 | 220 |
| -3 | 66 | 25 | 188 | 87 | 260 |
| -2 | 192 | 55 | 198 | 104 | 390 |
| -1 | 274 | 123 | 361 | 295 | 570 |
| 0 | 422 | 547 | 558 | 405 | 710 |
| 1 | 422 | 699 | 568 | 512 | 730 |
| 2 | 429 | 699 | 578 | 512 | 730 |
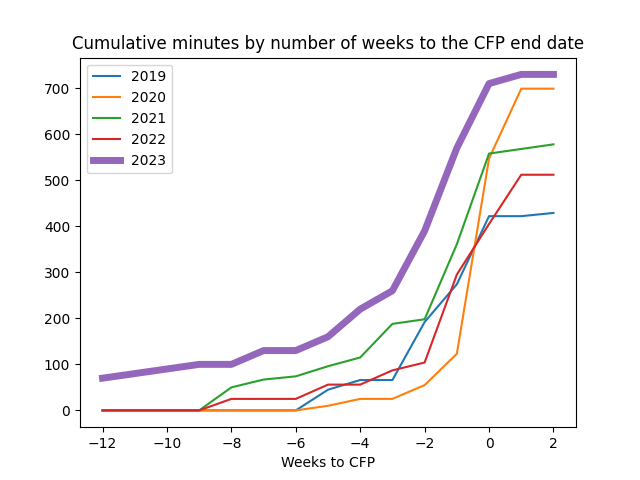
So… yeah… 730 minutes of talks for this year… I might've gotten a little carried away. But I like all the talks! And I want them to be captured in videos and maybe even transcribed by people who will take the time to change misrecognized words like Emax into Emacs! And I want people to be able to connect with other people who are interested in the sorts of stuff they're doing! So we're going to make it happen. The draft schedule's looking pretty full, but I think it'll work out, especially if the speakers send in their videos on time. Let's see how it all works out!
(…and look, I even got to learn how to do pivot tables and graphs with Python!)