Summarizing #EmacsConf's growth over 5 years by year, and making an animated GIF
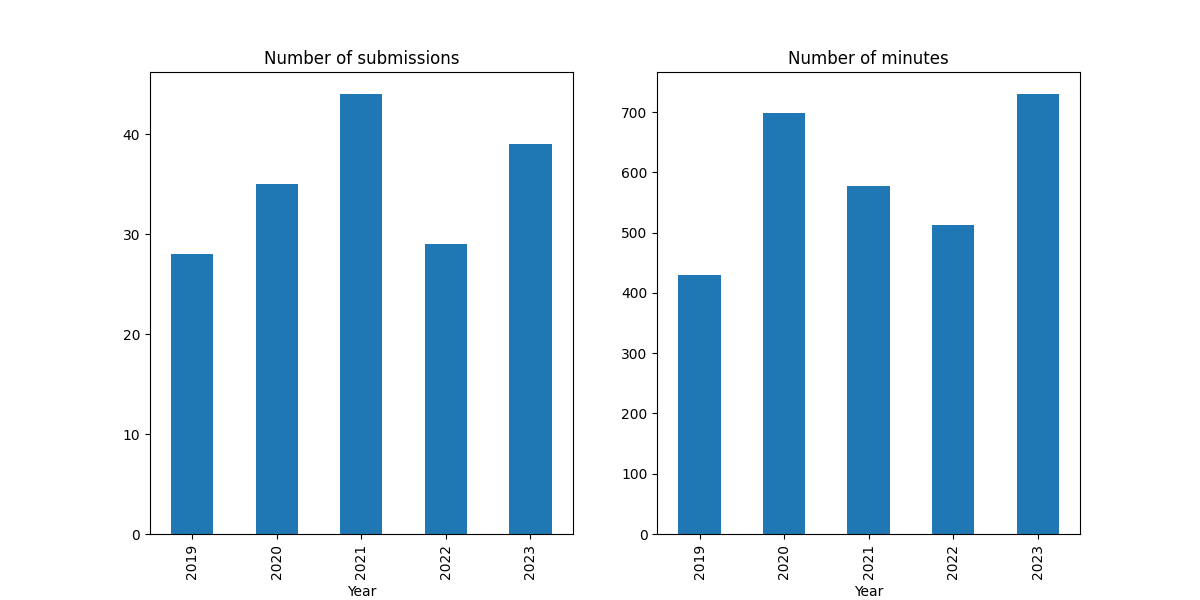
| emacs, emacsconf, pythonOf course, after I charted EmacsConf's growth in terms of number of submissions and minutes, I realized I also wanted to just sum everything up by year. So here it is:
import pandas as pd
import matplotlib.pyplot as plt
df = pd.DataFrame(data[1:], columns=data[0])
df = df.drop('Weeks to CFP', axis=1).groupby(['Year']).sum()
fig, ax = plt.subplots(nrows=1, ncols=2, figsize=(12,6))
fig1 = df['Count'].plot(kind="bar", ax=ax[0], title='Number of submissions')
fig2 = df['Minutes'].plot(kind="bar", ax=ax[1], title='Number of minutes')
fig.get_figure().savefig('emacsconf-by-year.png')
return df
| Year | Count | Minutes |
|---|---|---|
| 2019 | 28 | 429 |
| 2020 | 35 | 699 |
| 2021 | 44 | 578 |
| 2022 | 29 | 512 |
| 2023 | 39 | 730 |
I also wanted to make an animated GIF so that the cumulative graphs could be a little easier to understand.
import pandas as pd
import matplotlib.pyplot as plt
import imageio as io
df = pd.DataFrame(data[1:], columns=data[0])
fig, ax = plt.subplots(nrows=1, ncols=2, figsize=(12,6))
count = pd.pivot_table(df, columns=['Year'], index=['Weeks to CFP'], values='Count', aggfunc='sum', fill_value=0).iloc[::-1].sort_index(ascending=True).cumsum()
minutes = pd.pivot_table(df, columns=['Year'], index=['Weeks to CFP'], values='Minutes', aggfunc='sum', fill_value=0).iloc[::-1].sort_index(ascending=True).cumsum()
ax[0].set_ylim([0, count.max().max()])
ax[1].set_ylim([0, minutes.max().max()])
with io.get_writer('emacsconf-combined.gif', mode='I', duration=[500, 500, 500, 500, 1000], loop=0) as writer:
    for year in range(2019, 2024):
        count[year].plot(ax=ax[0], title='Cumulative submissions')
        minutes[year].plot(ax=ax[1], title='Cumulative minutes')
        ax[0].legend(loc='upper left')
        ax[1].legend(loc='upper left')
        for axis in ax:
            for line in axis.get_lines():
                if line.get_label() == '2023':
                    line.set_linewidth(5)
            for line in axis.legend().get_lines():
                if line.get_label() == '2023':
                    line.set_linewidth(5)
        filename = f'emacsconf-combined-${year}.png'
        fig.get_figure().savefig(filename)
        image = io.v3.imread(filename)
        writer.append_data(image)
I am not quite sure what kind of story this data tells (aside from the fact that there sure are a lot of great talks), but it was fun to learn how to make more kinds of graphs and animate them too. Could be useful someday. =)
You can e-mail me at sacha@sachachua.com.