Hmm, maybe I'm not slacking off after all
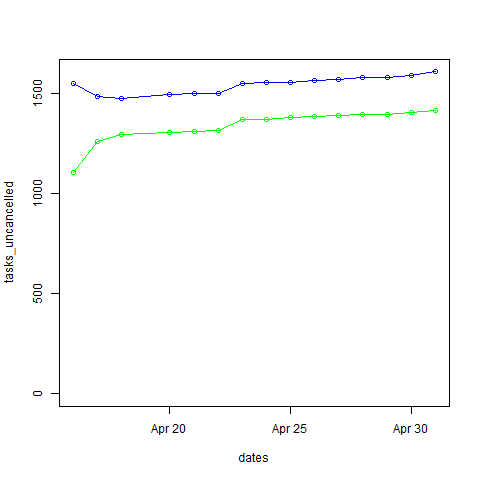
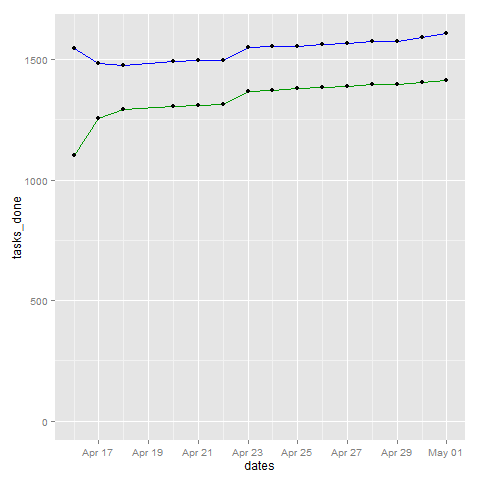
Posted: - Modified: | experiment, quantifiedEven though I've got the steady accumulation of DONE tasks showing my slow-but-constant progress, I still sometimes feel like I'm leaving something on the table when it comes to how I use my time. I feel like I'm living with a more relaxed pace, especially compared with the world of work around me or my fuzzed-by-time recollections of pre-experiment and early-experiment days.
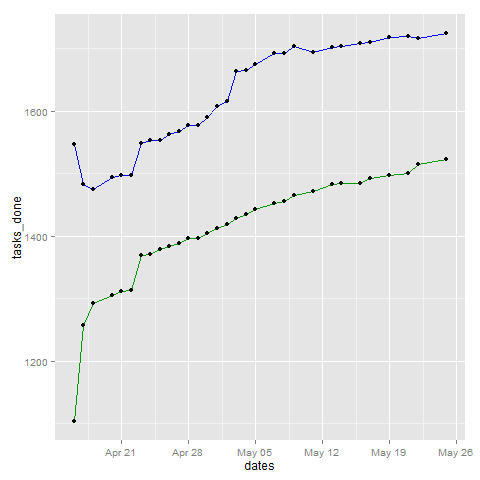
Top line = All tasks excluding cancelled ones, bottom line = DONE
I was thinking about how my time use has shifted over the past few years. I compared my percentages in different categories for 2012, 2013, and for 2014 to date. But the numbers say I'm actually spending more time on work and personal projects, and I do seem to manage to check off lots of things on my TODO list. =) So maybe I'm doing okay with this after all, even though sometimes I think I'm slacking off.
Top-level categories:
- Sleep: Pretty consistent (34.5-36.6%) – this works out to 8.3-8.8 hours a day.
- Business: Down, then up lately – 24%, 21%, 26%; but I expect this to be a little lower this year, since I'm taking three months off. =) I'll probably focus on even more writing, drawing, and Emacs geekery then. (And maybe a crash course in a useful skill…)
Avg hours per week 2012 2013 2014 to date Earn 20 15 17 Build 12 13 18 Connect 8 7 9 Total 40 35 44 - Discretionary: Up, then down – 18%, 22%, 16%
- Personal care: Pretty consistent (13-14%)
- Chores/unpaid work: Pretty consistent (7-8%)
As before, the business/discretionary trade-off is really the main thing that moves. The rest of my life stays pretty much the same. The second level of categories is worth looking at too:
- Writing is pretty consistent at 3%, or roughly 5 hours a week. Still, I think I'd like to write more. What should get reduced? Ah, video games have been soaking up a little time – although they're exercise too. Hmm, I could intensify that exercise so that I get more out of it. Oh! I've been spending more time gardening lately; that could be another reason. I like both of those alternative activities too, and I think they'll taper off after a while. That's okay, there'll be time enough to write more. Besides, some of my writing is filed under Emacs-related time instead. =)
- Trending up:
- Drawing (2.0-4.1%): This is good.
- Planning (0.2-1.5%): Hmm, this is interesting. Am I running into diminishing returns here? Maybe less time planning, more time experimenting.
- Emacs (0.4-2.8%), and I'm looking forward to spending even more time on this.
- Relaxing (0.6-2.0%)
- Trending down:
- Tidying up, cleaning the kitchen (2.3-1.6%) – about 3 hours a week? I should do more around the house (or maybe I am, and I'm not tracking it properly)
- Working on Quantified Awesome (1.4-0.8%) – steady-state since I'm happy with the code so far?
- Reading fiction (1.2-0.4%) – subsumed into other activities
- Socializing (8.0-1.4%) – big drop here; winter, becoming more selective?
- Networking (4.7-1.7%) – big drop here too; not networking as actively
- Biking (2.4-0.7%) – but then it's still early in the biking season, and I work fewer days too
I'll continue to focus on gardening for a bit until the garden is more established. I want to exercise and bike more as well. And there's all sorts of Emacs coolness to learn about and share! =) Writing will have to be content with these little snippets–thinking out loud, sharing what I learn, and other things like that–until I can spend more time focusing on developing ideas. Mostly, the increase in time on other activities seems to be coming from the time I used to spend socializing. I actually like this new balance. The stuff I make and share online seems to lead to more ongoing conversations than those hi-hellos at tech events, and I'm still happy to spend a few hours getting to know people or going somewhere.
I got the time numbers from http://quantifiedawesome.com and a bit of spreadsheet number-crunching, and the task numbers from Emacs + Org Mode + R. =) Yay data!