Coming back to my own time
Posted: - Modified: | life, parenting, time: Added links to other people's posts.
Text and links from sketch
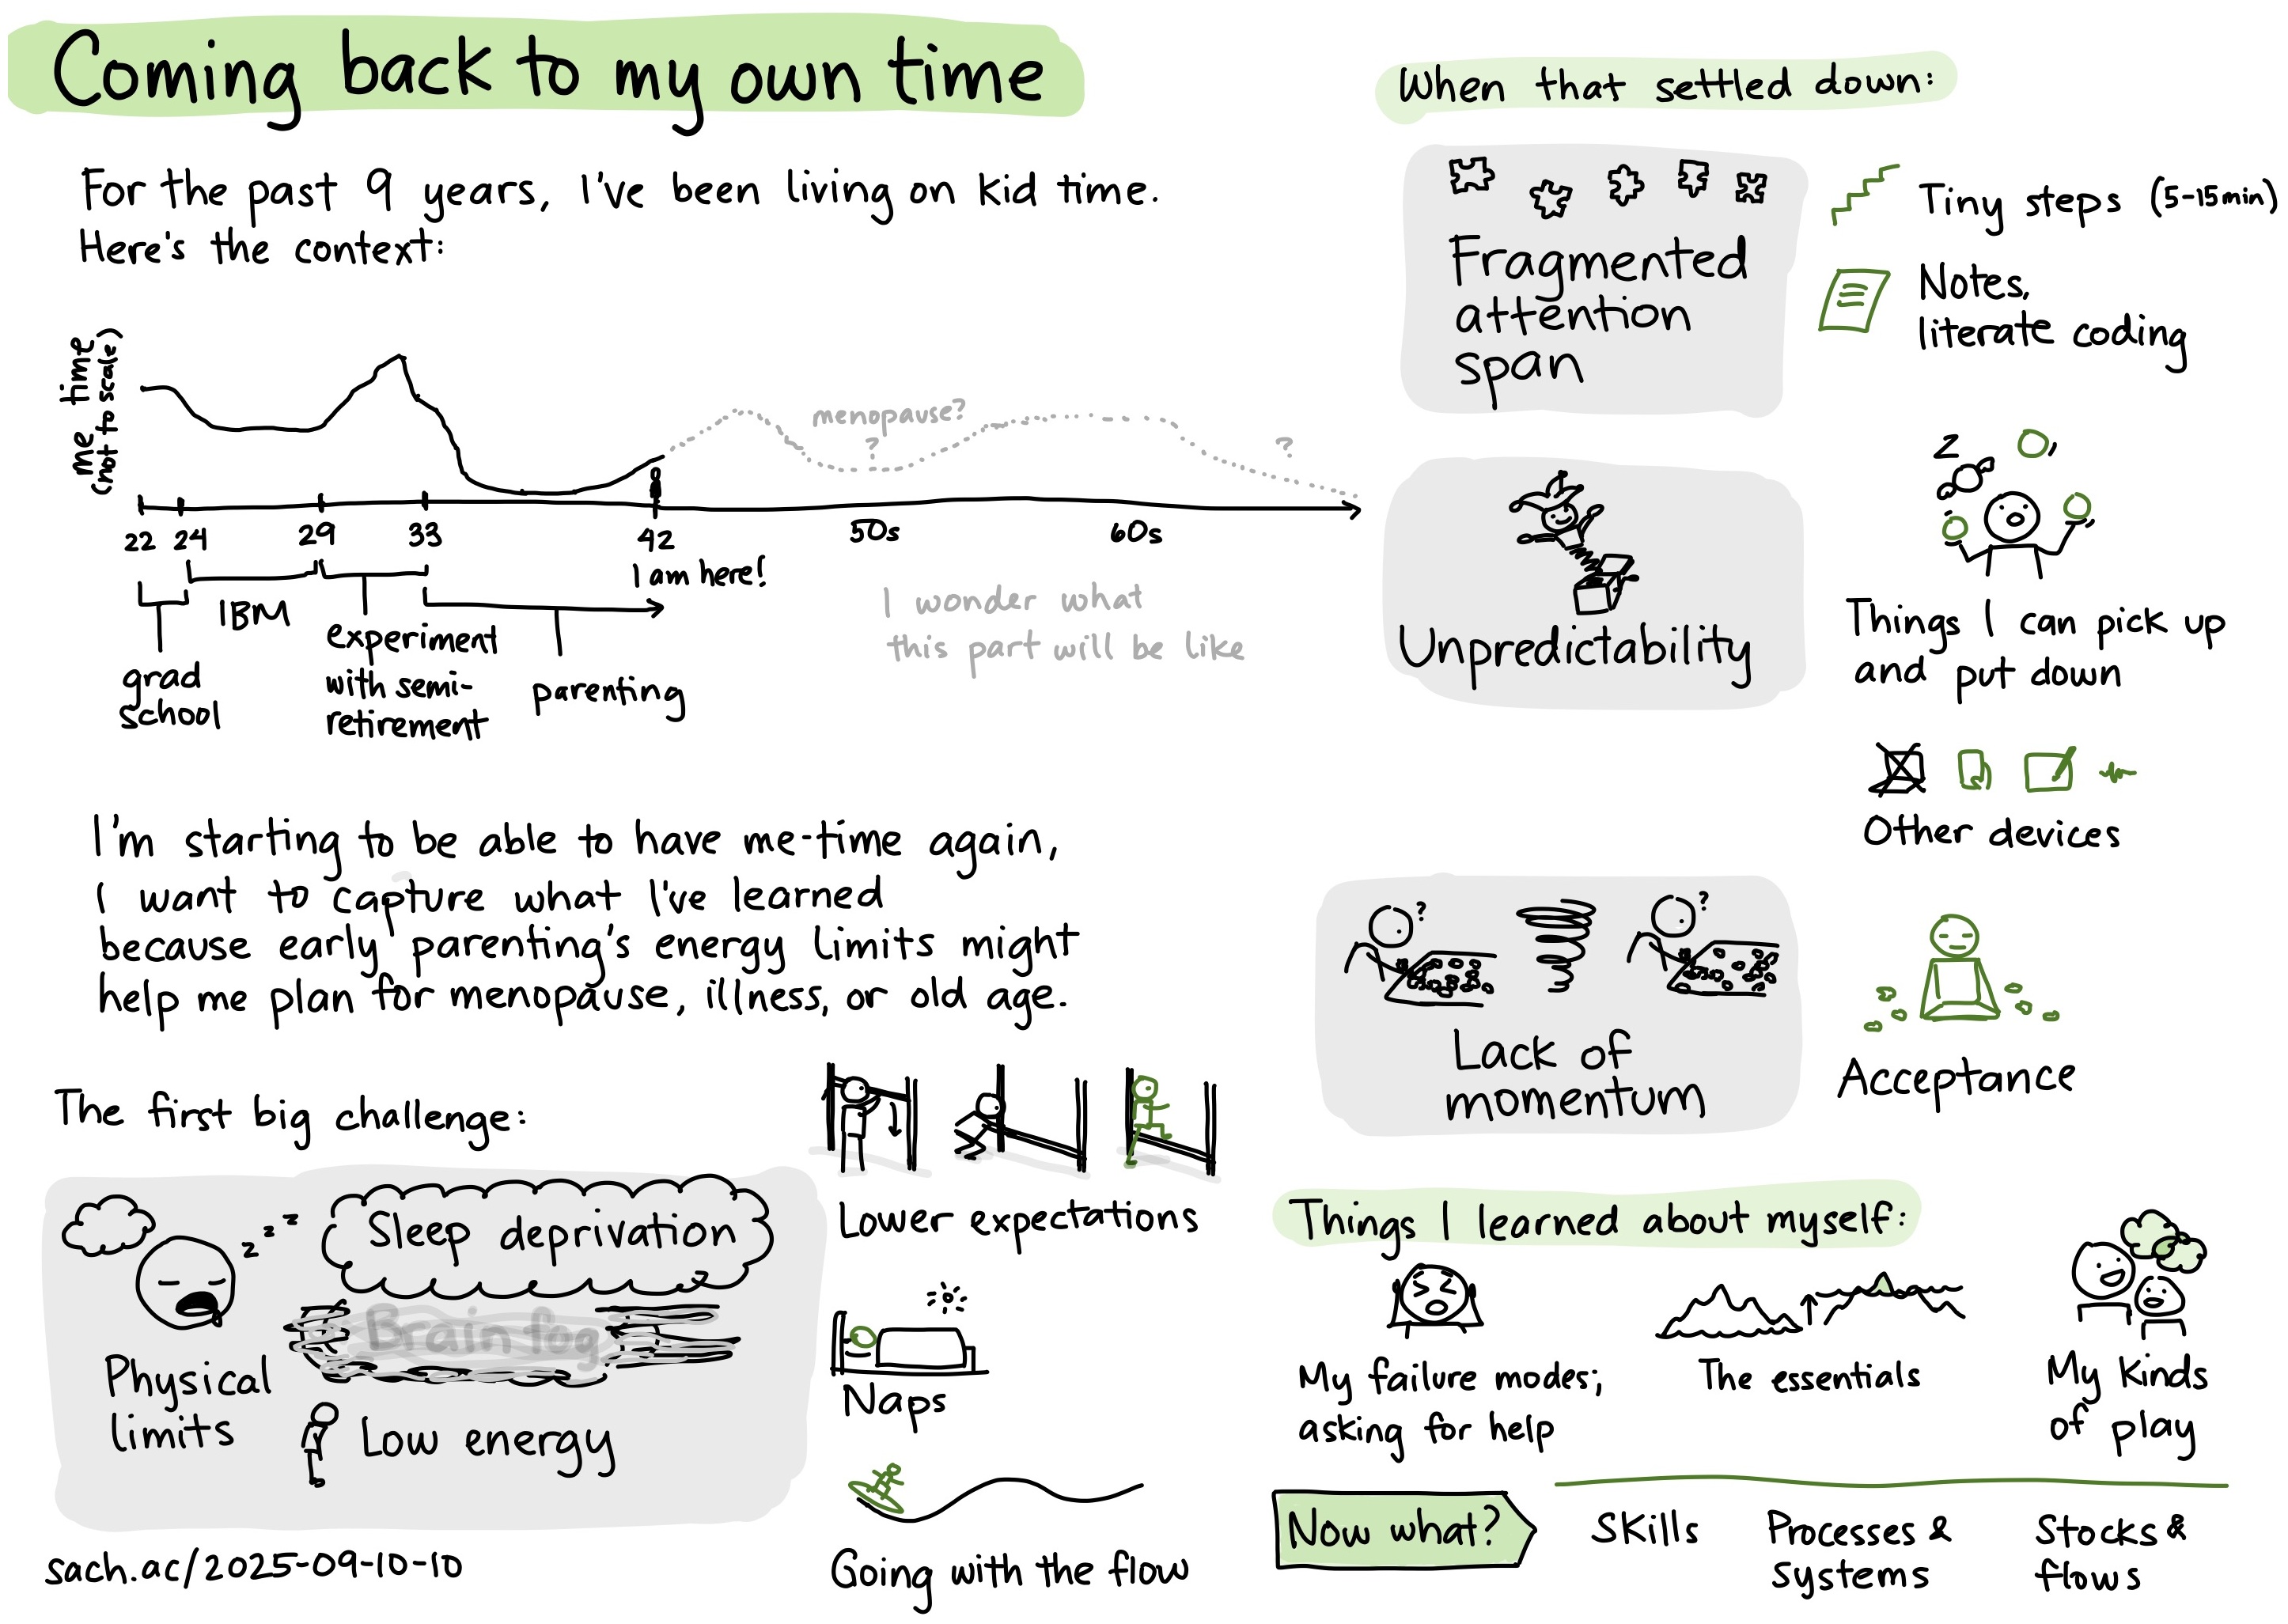
Coming back to my own time
For the past 9 years, I've been living on kid time.
Here's the context: me time (not to scale)
- 22-24: grad school - moderate
- 24-29: IBM - a little lower
- 29-33: experimented with semi-retirement - peak
- 33-42…: parenting; I am here! - very low, but gradually increasing
- 50s: menopause? - probably down a little
- 60s onwards: I wonder what this part will be like… - probably a decline
I'm starting to be able to have me-time again. I want to capture what I've learned because early parenting's energy limits might help me plan for menopause, illness, or old
The first big challenge:
- Physical limits
- sleep deprivation
- brain fog
- low energy
- How:
- Lower expectations
- Naps
- Going with the flow
When that settled down:
- Fragmented attention span:
- Tiny steps (5-15min)
- Notes, literate coding
- Unpredictability
- Things I can pick up and put down
- Other devices
- Lack of momentum
- Acceptance
Things I learned about myself:
- My failure modes; asking for help
- The essentials
- My kinds of play
Now what?
- Skills
- Processes and systems
- Stocks and flows
The door clicked shut. A+ had just shooed me out of her room, and she was already back at her desk waiting for her virtual grade 4 class to begin. She's got this. And all of a sudden, I had time for myself. I could have two focused-time chunks of a few hours each, straight, several days in a row. I've made it to the other side of the early parenting time crunch. I could start dusting off all those ideas that I've shoved into my notes for a long-imagined someday. That someday could be today.
Before I settle back into the world of being able to string two thoughts together, I wanted to reflect on this past almost-decade of voluntarily giving up my time autonomy. I don't know how much of my experience can translate to other people's lives. I've been so lucky in the choices we got to make. But I'd better write down my notes before I forget.
Physical limits
I knew I was signing up for a lot when I decided to become a parent, but the sheer challenge of running into my physical limits was still eye-opening. Well, eye-closing. Sleep deprivation was so tough. My sleep was as fragmented as A+'s (newborns have no idea about night or day) and didn't get back to normal-ish until 2019 or so, when A+ was 3 and I was 36. I stumbled through the day with perpetual brain fog and low energy. I had had slow days like that before, too, especially during the third trimester, but it's a whole 'nother kettle of fish when you're responsible for another human being who wants to play with you and who gets stressed if she detects you're stressed.
Mostly I dealt with this by lowering my expectations. I scaled my consulting way, way down. There was nothing urgent that I needed to work on. My personal projects could generally be postponed for a few years. I could just focus on putting one foot in front of the other, keeping this tiny human alive and reasonably happy.
If it was a particularly rough day and I knew I wouldn't make it to when she'd finally fall asleep the following night, I napped while A+ was with W-. I learned to be more in tune with my need for sleep and food and quiet, because when I misjudged them, bedtime was inevitably rough. Sometimes I just had to step back, close the door, and cry: exhausted, touched-out, overstimulated, trying to pour from an empty cup.
Days went more smoothly as we learned to go with the flow. Some days we were in sync: bright and enthusiastic and engaged. Some days were just slow days. Some days I said, "I'm too tired to think of something creative right now. I just can't come up with funny stories or interesting voices right now. Let's find something low-energy that I can play with you."
It took a few years for us to figure out a sleep rhythm that worked for us. When she started snuggling to bed at a more reasonable time and sleeping for a bit longer, I really appreciated being able to sleep again. I really appreciated being able to think again.
To be fair, I voluntarily chose this path knowing what it entailed. We didn't sleep-train. I nursed on demand instead of getting her used to a schedule. We didn't use daycare or have any external scheduling pressures. There were only a few instances when I felt stretched beyond my limits. We seem to have survived without losing too much (aside from some of my brain cells), and we might have even gained a few things along the way.
Fragmented attention span
Even after we more-or-less figured out sleep and other physical constraints, I still needed to learn a lot about adjusting to my new reality. A+ was curious about everything. As her default parent, I was her voice-activated guide to the universe. "Mom!" "Mom!" "Mom!" punctuated my day into fragments. There was no space for longer thoughts during the day. I couldn't put my thoughts together or figure out where they fit into the big picture. Sometimes, if I felt confident about my sense of her sleep cycle, I stayed up late or woke up early to have maybe 30-60 minutes of me-time. Too many days of that in a row, though, and I'd find myself slipping back into sleep-deprived zombie mode. It was a balance.
I did better whenever I broke my ideas down into tiny steps. I might not be able to code for two hours to fully puzzle out a new feature, but I could squeeze in 15 minutes to write a function. It reminded me of when I used to work on a tiny computer, which forced me to build programs out of shorter functions that each fit on one screen. Now I had to learn how to build ideas from short paragraphs that fit on my mobile phone in between the notification bar and the onscreen keyboard. If I managed to squeeze in a little computer time, I focused on tiny workflow improvements that might let me pack a little bit more into the next computer session, like a function that collected my Reddit upvotes so that I could use that as a starting point for Emacs News1, or a way to compare automatically-generated subtitles from the Whisper speech recognition engine with the speaker's script to identify things they might have ad-libbed2 (or maybe even automatically correct them). The Emacs text editor's programmability worked really well for this. I just kept sanding down the rough spots in my workflows, and things flowed more smoothly.
Taking notes helped a lot, too, especially whenever I could use the literate programming technique of having my code, notes, and links right on the same screen. It meant that I could use those notes as a jumping-off point when I got back to something after fifteen minutes of conversation about what A+ learned about Star Wars characters had wiped the context from my mind.
Sometimes I felt too time-starved to take notes, or I told myself I didn't need to take notes because it was still in flux and I hadn't figured out how I wanted to solve the problem yet. Whenever I tried to move quickly without notes, I always ended up regretting it later because I needed to figure things out all over again. In 2022 I did a mad scramble to make EmacsConf 2022 a two-track conference so that we could fit all the talks in, and I spent much of my EmacsConf 2023 prep time trying to figure out how I pulled it off.
The fragmentation of my attention span might have been manageable if it had been predictable. Many people like the pomodoro technique for breaking up intense focus with breaks, after all, and I'd reflected on the value of interrupting my own momentum even before I had A+. But "predictable" definitely didn't describe my life with A+. Knowing how much it helped me to surf the ebbs and flows of my energy, I wanted to experiment with going with A+'s flow too: helping her learn the things she wanted to learn at the time she wanted to learn them, letting her tune in to what she needed and when. I figured it might be interesting for me to open myself up to as much as I could get, even if it meant tough days from time to time.
Unpredictability
Things got better as A+ grew. A+ got the hang of reading fairly early. When she learned how to read silently faster than I could read to her out loud, and she began to lose herself in the stacks of books I strewed around the house, I started to have unexpected pockets of free time when no one was talking to me and I could actually think my own thoughts. This was unpredictable, though. I couldn't use the time for coding or consulting, because she would invariably wander back while I was in the middle of a complex thought, and then the Ovsiankina effect meant that I was trying to hang on to that task in my head so that I didn't lose all progress. It would rattle around in my brain until I got a chance to finish it or at least properly braindump some notes. Eventually I was able to get A+ to understand me when I said, "I just need five minutes to finish this thought," but I definitely needed to be able to wrap things up in that sort of timeframe instead, of, say, spending an additional thirty minutes trying to figure out how to un-mess-up a production environment.
I shifted to things I could pick up and put down easily. Emacs News mostly involves collecting and categorizing various links, so that was much easier to interrupt as needed. Writing and drawing got better as I got the hang of following an idea across different tools for thinking about it: audio braindumps, sketches, bouncing writing between my phone and my computer. The laptop was cumbersome to move from room to room, but I could clip on a lapel mic or pop in some earphones when I was doing chores by myself. My SuperNote A5X (and later on, my iPad) was light enough to take to the playground if I happened to have a moment to myself during a playdate, although I was still ready to play with A+ in case she didn't feel like joining the games the other kids wanted to play.
Lack of momentum
Short, unpredictable fragments of time could probably still have been pieced together into something more useful if they had been denser, like when a cluster of puzzle pieces gives you enough of a sense of a picture to motivate you to keep going. But I didn't have enough of them close together to build momentum. Coding requires holding context in your head: what the task is, where files are, what functions do, how to run the code, even the syntax of the particular programming language I wanted to work in. I couldn't make much headway on projects since I kept forgetting the context in between sessions, caught up in the whirlwind of life with a small child. It's as if I was trying to put together a detailed jigsaw puzzle, and then this whirlwind would come and scatter all the pieces. Not only that, I felt stretched between the different things I was juggling, all the puzzle pieces jumbled together with no clues. I eventually accepted that bigger puzzles would have to wait for someday, and that it was time to enjoy the moment instead.
I knew, intellectually, that things would be different and I wouldn't be able to put my thoughts together for a while. For the most part, I was able to just capture ideas on my phone using Orgzly Revived and postpone them to the far future when I'd have time to explore them. I might not have expected an ongoing global pandemic to mess up the usual timeline for being able to get chunks of time back, but I had theoretically signed up for the possibility of, say, having a child with major support needs, so it was part of what I'd considered and assented to before we started down this path of parenting. Still, there were times when I felt like declaring: "I am a person and I want to be able to complete this thought and solve this problem." When it got to that point, W- was usually able to give me a few hours (or even a few days, like the weekends I ran EmacsConf) to feel like me again.
Things I learned
Now A+ has settled into the rhythm of virtual grade 4, and new possibilities are beginning to open up. Time to crystallize what I've learned before it dissipates into forgetfulness.
I learned about my failure modes, and I learned about asking for help. It was good to find out where and how I fall apart, and how I can piece myself back together after a nap or a good playdate. I accepted that sometimes I would just totally blank out on things to say or do, and I grew to appreciate Toronto's playgrounds, libraries, early childhood centres, and activity places. I got more acquainted with my anxiety and we figured out ways to work with it. I learned that yes, I can still love a tiny baby even after she has clamped down hard with her mouth on part of me that doesn't like getting bitten (that's all of me, really; why?! why would you do that?!), and I can quickly learn to keep my hand nearby so that I can pry her gums apart.
It was interesting to see who I was and what I did when everything had to be stripped down to the essentials. I mostly stayed regulated. I still picked experimentation and curiosity. I didn't have the brainspace to consult, code, or untangle complex thoughts, but I enjoyed putting together Emacs News and capturing moments through drawings. I used little bits of time for incremental improvements.
I've learned a little bit more about our kinds of play, mostly by taking advice from cartoon dogs. I had a hard time with pretend play in the beginning, but it's easier now that we have so many interests to draw on. I'm not very physical, but I enjoy biking and skating. I like wordplay, drawing silly things, making up songs, and figuring out life together through experiments.
Looking ahead
So what can I take from this crash course on my constraints?
The results of this stress test give me some ideas for skills I can develop. Paying attention to my needs for sleep, food, and quiet helped me through the tough days of early parenting, and failing to do so had pretty clear consequences. I want to get even better at tuning in and taking care of myself. Then I can both go with the flow and notice when I need to make longer-term adaptations. Those years of brain fog and low energy made it clear to me that I'd really rather not have to go through that again earlier than I need to, so I may need to get better at protecting and advocating for health. As I move into a time when I won't be able to capture significant moments with pictures or videos (because of privacy or simply because many important things are invisible or unrecognized in the moment), I want to get better at observing, reflecting, writing, and drawing. Sketching my thoughts and observations might help me capture more in a compact, expressive way. Anticipating the physical and mental upheaval of menopause, I can get better at untangling and processing my feelings. Knowing that I'm going to run into things I can't do on my own, I can learn more about available resources and practise reaching out. There's also a whole bucketful of practical life skills that might be good to learn. There are also interests that are good for me, like gardening and piano. All of these things can work in the long run. There are people who write or draw into their 70s and 80s, even with physical challenges.
If I want to do this long-term, knowing that more of these challenges are likely to be in my future (if I'm lucky), I can work on processes and systems that can help me. A habit of writing as I go (and the tools to make this easy) will help me if menopausal brain fog messes up my attention span. Calendars and reminders can help me stay on top of things I need to do. Exploring alternative user interfaces like speech might help if typing gets difficult. Who knows, by the time I need this kind of support, maybe large language models will be well-situated to help me with tip-of-the-tongue, similarity search, and other information retrieval tasks.
Cognitive processing speed tends to decline over time, but crystallized knowledge accumulates.3 If I may have to think less, at least I can try to think more deeply, connecting ideas and experiences. Instead of looking back at the end and trying to conjecture about what I must have been thinking or feeling, I'd love to take good notes along the way, kinda like the mnemonic slurry Cory Doctorow mentioned.4 I want to keep improving the flow of ideas in and posts out. I want to keep adding to my stock of notes and inspiration. (And I want to have good backups and a way to shift from one thing to another as needed.)
Getting through early parenting was challenging, even though I was already playing on easy mode compared to lots of other people. Things are a little smoother now, but I know it's going to be tougher in the future. There might be big projects in my someday pile, but I'm not going to tackle them yet. I'm still easing into thinking again. Tiny steps, incremental improvements. It's good to start getting ready.
Related posts
- Looking at my time data from 2012 to 2025 (2025)
- Thinking about time travel with the Emacs text editor, Org Mode, and backups (2025)
- Preparing for middle age (2023)
- Slow days, weeks, months, years (2023)
- Making better use of time as we grow more independent together (2022)
- Experience report: Toronto's Early Years resources were really helpful (2020)
- Adjusting to less focused time (2018)
- Dealing with preoccupation and a slow tempo (2018)
- Slow days (2018)
- Dealing with thought fragmentation, reducing mental waste (2018)
Elsewhere:
- Lunarbaboon comic: Finished "My kids don't need me as much anymore… I can finally do the things I want again. It feels like it has been years since I've had time. Time to read, think, draw… Maybe even finish a comic for once." "Wanna like do something with me?" "Always." (last panel in pencil: "What should we do?" "No idea.")
- More Than Someone’s Mom with Ashley Audrain - Good Inside: I liked how this podcast episode talked about the pressure to be a Good Mother and how we tend to forget or neglect the other parts of ourselves. Now that A+'s a bit older and wants more autonomy, I'm deliberately stepping back and focusing on my own stuff to keep my brain busy and let her decide when to ask me for help (if at all).
- You're a Slow Thinker. Now what? - by CasualPhysicsEnjoyer: I liked how this post was about leaning into slow thinking. People used to remark on how quickly I solved problems. I feel a lot slower these days, but that's okay. I'm learning how to work with it. Drawing is interesting. It slows me down even further, but I think I get a lot out of it.
Footnotes
my-reddit-list-upvoted in my Emacs News Org file
subed-wdiff-subtitle-text-with-file in subed-common
Murman DL. The Impact of Age on Cognition. Semin Hear. 2015 Aug;36(3):111-21. doi: 10.1055/s-0035-1555115. PMID: 27516712; PMCID: PMC4906299. (HTML accessed 2025-09-12)
My composition is greatly aided [by] both 20 years' worth of mnemonic slurry of semi-remembered posts and the ability to search memex.craphound.com (the site where I've mirrored all my Boing Boing posts) easily.
A huge, searchable database of decades of thoughts really simplifies the process of synthesis.
Cory Doctorow in Pluralistic: 13 Jan 2021
Also related:
And it's interesting, right, this accretive note-taking and the process of taking core samples through the deep time of your own ideas.
Matt Webb in Memexes, mountain lakes, and the serendipity of old ideas

