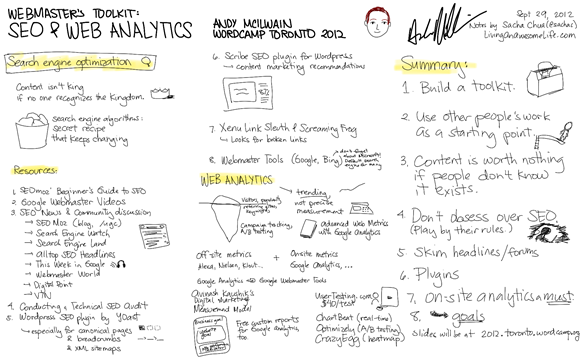
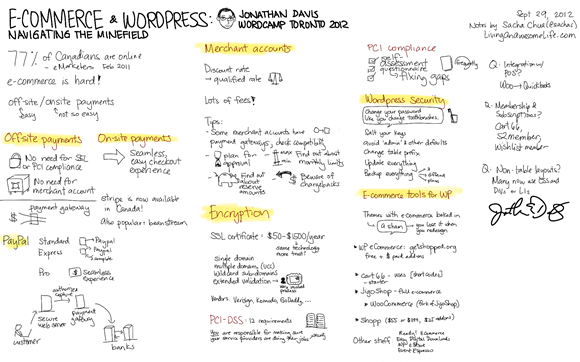
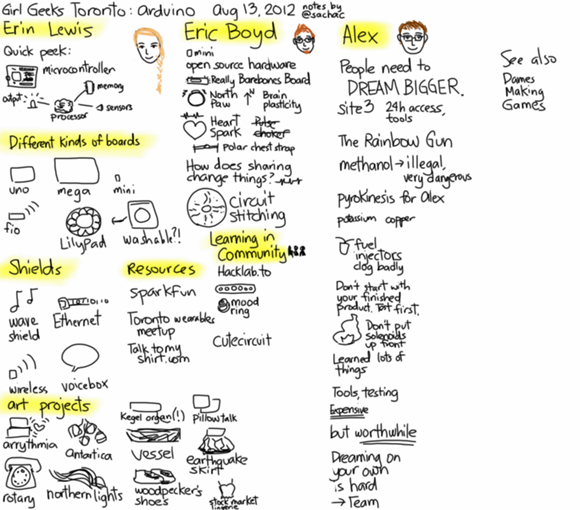
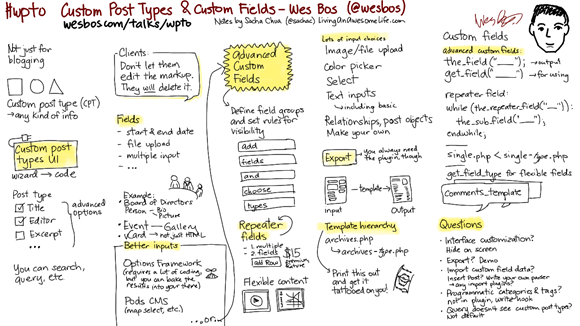
See or search my sketchnotes from the event in Evernote
Thursday, September 13, 2012
I took copious notes at the Quantified Self meetup organizers’ workshop (http://j.mp/qsorganizers).
How I’m going to apply what I learned: We’re planning to organize pub nights after our meetups. If there’s local interest and I have time, we might offer coaching too. I’m also interested in prototyping a global directory for Quantified Self folks, and look into virtual meetups.
Saturday, September 15, 2012
Opening plenary
- Gary Wolf: Basic conference guidelines (start and end on time, must be a personal story, doesn’t have to be polished)
- Ernesto Ramirez: > 70 meetups, > 10,000 members
- David Maskin: Citizen science
- Gary Wolf: Practice and mistakes, thinking, data all the way in
- Robin Barooah: Coffee, meditation, learning from the data
- Nancy Dougherty: Making smiles visible, triggering smiles
How I’m going to apply what I learned: The next time I track the beginning of a habit, I’ll also do the reverse habit tracking that Gary Wolf used, looking at # of days skipped and longest skip. I like the way of seeing the improvement in habit consistency over time.
10:30am Session 1
- Dr. Alan Greene: reverse mood tracking – paying attention to the changes in his emotions in order to learn more about how his patients felt. Before going through a door, he pays attention to how he’s feeling. After he walks through it and meets people, he considers his emotions again, and then asks a probing question based on the change. He’s right about half the time.
- Amy Robinson: tracking her ideas (she e-mails ideas and inspiration to herself) and graphing the connections between ideas using Gephi. She analyzed six months of e-mails and organized them by topic in order to see the interconnections. She would like to be able to visualize the gaps.
- Sacha Chua: My session! See the slides, dashboard, and source. People told me that they found the load-balancing of clothes amusing, and they were glad I released my dashboard code as open source.
- Mark Leavitt: quantifying seat time. He built a more ergonomic workstation (split keyboard) into a comfortable chair, then added a compact elliptical trainer that he wired up to an LED for feedback. (Maybe something like this InMotion elliptical trainer?) That way, he was motivated to keep pedaling while he was sitting at work. Key idea: If you can’t or don’t want to break a habit, hack it to be better for you.
How I’m going to apply what I learned: I’ve been moving more of my notes into Evernote, and when I reach 10,000 notes, I’ll look into doing that kind of visualization as well. I’m also curious about building a more associative notetaking system like Mark Carranza’s, and that might be good for mapping too. If I set up a more permanent home office, I might look into getting a small elliptical trainer as well.
12:00pm Lunch and Ignite talks
- Jason Langheier: The power of routines; changing your defaults to be healthier; personalized meal recommendations using zipongo
- Charles Wang: Lumoback for tracking posture
- Dave Marvit: Helping veterans with post-traumatic stress disorder (PTSD) be able to drive again; GPS and stress map-based visualizations; meditation helps
- Daniel Nofal: Wikilife – open data, open API, open source
- Joshua Manley: Data-driven health coaching
- David Fetherstonhaugh: Shirt- and Sharpie-based survey during a run; about ~50% filled out; measurement is a lousy invitation to engage; social effect
- Greg Schwartz: Burned way more calories at Burning Man (daily rate: 3450-4300 normally, 4433-5764 at Burning Man); fire poi 13 cal/min
How I’m going to apply what I learned: Friends back home are into hula-hooping, so I might take up hooping and poi again as a form of fun exercise. I just have to figure out where this is going to happen, space-wise…
1:30pm Session 2
In the Habit Design (Michael Kim) breakout session, people shared their experiences on building habits that lasted for at least 100 days. The breakout organizer shared some research that was sceptical of the Hawthorne Effect. People talked about making sure they have their healthy defaults in stock, taking advantage of accountability (especially to people they didn’t know), increasing the cost of not doing something, checking in with friends, gamification, letting people hit the pause button, changing responses to habit triggers, and so on.
In the Reducing Friction in Quantified Self Technologies (Boby Sakaki, Phillip Thomas) breakout session, we talked about getting other people involved in hypothesis generation, helping them develop strategies for recovering from failure, and customizing the UI.
How I’m going to apply what I learned: I’ll brainstorm a list of habits I’d like to build, and then focus on building one habit at a time for 100 days. For the next 100 days, I’ll work on building more of a habit of exercise.
3:00pm Session 3
I went to the Crossing the Data Desert (Vahe Kassardjian, Rafi Haladjian) breakout session. The initial part of change and data collection is very interesting, but then there’s this long period of having answered the “obvious” questions before you can get (often surprising) value from long-term data. It’s a little like the plateau of mediocrity. We talked about the need for other people (especially physicians) to recognize and respond to data, the value of seeing other people succeed, “unlocking” new analyses or levelling up, and sharing other people’s questions/hypothesis in order to encourage people to look at their data in new ways.
How I’m going to apply what I learned: I’m curious about the ability to share questions/hypotheses and quickly analyze your own data in the light of new questions, and I might build it into some kind of directory/data analysis service.
4:30pm Closing Plenary
Sonny Vu, Amar Kendale: Sensors Sewn In: A Wearables Conversation. The panel was really light on specifics, so we’ll just have to see how the hardware turns out.
Larry Smarr: Frontiers of Self-Tracking. Hilarious and insightful talk about what happens when a scientist with access to a supercomputer and a research team starts digging into his own microbiome. Bonus 3D-printed model of the intestinal passage that’s been giving him problems.
How I’m going to apply what I’ve learned: Nothing much that I’m going to act on within the next year, but it’s good to know what’s out there.
Sunday, September 16, 2012
9:00am Opening Plenary
- Nick Winter: Testing 11 factors in 3 months using an intervention schedule in order to tease out interactions; quantified-mind performance vs creatine, walking, piracetam, etc.
- Adriana Lukas: Need for open & exportable data, data literacy
- Daniel Rosenberg: History of timelines; Joseph Priestley’s 1765 Chart of Biography; patterns; historical and cultural assumptions about graphing; these graph types were radical inventions once!
- Indhira Rojas: Interesting data visualization experiments; how can we look at things in a very different way? Typical reaction “I don’t understand it” / abstract art, but that’s normal
How I’m going to apply what I learned: I’ll use quantified-mind to establish a baseline and then experiment with some factors, and I’ll check out some of the experimental visualizations people shared.
10:30am Session 4
I went to the Best Practices in Data Viz (Lee Lukehart) breakout session. Resources for that session are at http://evernote.com/pub/savvydata/qs2012_dataviz_breakout . We talked about tools for crunching and cleaning up data (ex: Data Wrangler), the kinds of transforms you might do with data, different types of charts, the power of small multiples, and other tips for data visualization.
How I’m going to apply what I learned: I want to build more graphs for Quantified Awesome, possibly with nvd3. I’m also looking forward to capturing more data streams so that I can ask other questions about my data.
12:00pm Ignite talks
- Hind Hoboeika: Butterfleye heart rate monitoring for swimmers
- Jan Peter Larsen: Automated activity tracking with the smartphone; change in behaviour
- Natalie McKeever: Internal worlds art installation; entrainment of heart rate rhythms; other animal species’ slower heartbeat = relaxing
- David Albert: Getting people engaged in their own health; measuring heart performance with an iPhone
- Yasmin Lucero: Baby tracking, RPubs
- Anne Wright: Data aggregation with Fluxtream and Bodytrack
- Paul Abramson: MyDoctor (tracking-assisted healthcare); emerging “quant coach” role as part of healthcare team; visualizing and telling stories based on data
How I’m going to apply what I learned: I’m going to check out RPubs for other interesting visualizations. Also, it was reassuring to learn from the patterns that Yasmin observed!
1:30pm Session 5
At the A Memex for the Quantified Self (Betsy Masiello, Jess Hemerly) breakout session, we listed things we were currently recording and what we’d like to be able to record. I bumped into Mark Carranza, whose MX text-based associative memory system is pretty darn awesome. Many people are interested in more passively-tracked data as well as correlating their data with external sources of information. People were also interested in visualizing and navigating one’s records. Some things to consider: Fluxtream, Traqs.me, singly, Muse (Stanford), Nvivo (blog analysis), Proust, 1000memories, Storytree, Zoom Recorder.
How I’m going to apply what I learned: I’d like to eventually build a timeline view of the different things I track. I’m also really curious about Mark Carranza’s MX, and may build something like that myself.
3:00pm Session 6
I skipped the breakout sessions in favour of conversations with Mark Carranza about his MX and with Ian Li about building a Quantified Self directory. I did go to the Quantifying Personal Communications (Noah Zandan) office hours, although that turned out to be more of quantification-based presentation coaching. I had a good discussion with Dan Tasse about tracking and analyzing personal communication, though.
4:30pm Closing Plenary
Stan James showed the results of his hourly webcam+screenshot routine (LifeSliced), which was funny and an interesting productivity hack.
Kevin Kelly wrapped things up by talking about the explosion of data and how we might be able to turn that data into new senses that extend our selves. He also proposed that data should be treated like the alphabet – no one owns it, people have access to different forms of it, access comes with rights and responsibilities, and data goes back to the commons after some time.
How I’m going to apply what I learned: Nothing I’m planning to act on in the short term, although I suppose that opening as much of my data as possible is part of it. I thought about setting up a similar webcam+screenshot thing on my computer, but I don’t like low-angle, badly-lit shots. <laugh> So maybe it will be something else.
See or search my sketchnotes from the event in Evernote
Went to the conference? I’d love to read your notes! Tweet them with the #qs2012 hashtag or comment with a link below!

