Here’s what I’m learning about being clear about your goals and analyzing how your actions match up with them. I’ve been thinking about my goals for blogging because I want to get better. I have time to learn things, and I can learn more effectively if I learn deliberately. It might work for you too!
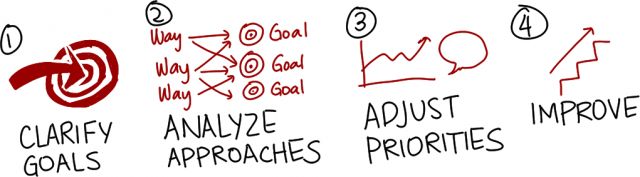
1. Clarify your goals
It’s good to know what your goals are and how the different approaches serve those goals so that you can choose the ones that are the most effective. You can also look at each approach to see how you can improve it.
After some reflection, I came up with this list of goals for my blog:
- Learn more effectively by thinking through complexity or explaining what I’m learning
- Explore assumptions and possibilities; become more aware of them myself, and help other people see them
- Improve core skills through practice: making decisions, explaining ideas, organizing thoughts, etc.
- Save myself and other people time spent re-solving the same problems or learning the same things
- Build a long-term archive that I can use to remember what I’m learning and see differences over time
- Learn from other people through questions, comments, and conversations
Your list of goals will probably look different. Many people have goals such as building a business by promoting their products or services, educating clients or readers, keeping family members up to date, working through difficult issues by writing anonymously, and so on. Take a moment to think about and prioritize your goals.
If you’re having problems expressing your goals, you can also take a look at your recent blog posts and ask yourself, “Why did I write this?” What results did you want to get? What purpose did it serve? One blog post might work towards several different goals.
2. Analyze the ways you approach those goals
Different actions support different goals to different extents. Think about the different types of blog posts you write. Score them against each of your goals on a scale of 1 to 5, where a score of 5 means that type of post helps a specific goal a lot, while 1 means it does very little or even nothing for that particular goal.
Here are some of the types of posts I share and how they line up with the goals I listed above:
|
Goal 1: Learn |
Goal 2: Explore |
Goal 3: Improve |
Goal 4: Save time |
Goal 5: Build |
Goal 6: Learn from others |
Total |
| T1: Draw original stuff |
5 |
5 |
5 |
5 |
5 |
3 |
28 |
| T2: Draw book reviews and events |
5 |
2 |
5 |
5 |
5 |
5 |
27 |
| T3: Think out loud |
5 |
5 |
5 |
1 |
5 |
3 |
24 |
| T4: Share tech tips, troubleshooting notes, or code |
5 |
5 |
3 |
4 |
2 |
4 |
23 |
| T5: Review longer spans of time (yearly, decisions) |
5 |
4 |
5 |
1 |
5 |
3 |
23 |
| T6: Write tips that few other people can cover |
4 |
2 |
3 |
3 |
4 |
3 |
19 |
| T7: Write tips that other people can also cover |
3 |
1 |
2 |
2 |
2 |
2 |
12 |
| T8: Review recent posts (weekly, monthly) |
1 |
1 |
4 |
1 |
4 |
1 |
12 |
Sorting the table by the total score makes it easy to see which approaches you value more. If some goals are much more important to you than others, you can also weight those goals in your calculations. For example, if building a long-term archive was twice as important to me, I could double that column when calculating the total score.
Anyway, this ranking makes it clearer why I feel good about original drawings and sketchnotes, and why I skew towards decision reviews and “thinking through things”-type posts even if they don’t feel focused enough on saving other people time. Most of the blogging advice tends to focus on writing tips, but they don’t motivate me as much.
How about you? Do your post types match up with your goals? Are there clear winners that you should focus on? You can write lower-value posts from time to time because they address different needs. For example, I post weekly reviews because they’re useful to me even if they’re less useful for others.
3. Adjust your priorities based on feedback
Of course, since these values are subjective, it helps to adjust them based on your website analytics or feedback from your readers. For example, if you think a type of post saves people a lot of time, you’ll probably see a lot of visits or comments on it. If you have Google Analytics, you can export the Content – Site Content – All Pages table to a spreadsheet, classify the top X links, and then see what types of posts people spend their time on. For example, I analyzed the top 500 pages visited in July 2013, classified each by type, calculated average views and time per page, and sorted it by average views to get a sense of which posts tend to be more popular.
| Post type |
Number of pages |
Number of views |
Average page views per page |
Average minutes per page view |
Average bounce rate |
| T1: draw original |
23 |
2875 |
125 |
3.4 |
67% |
| T4: share tech |
149 |
12468 |
84 |
5.8 |
74% |
| T2: draw book / event |
41 |
2346 |
57 |
2.3 |
64% |
| T3: think out loud |
62 |
2452 |
40 |
3.4 |
72% |
| T5: review long / decision |
14 |
504 |
36 |
2.7 |
73% |
| T6: write tip (few) |
41 |
1392 |
34 |
3.1 |
72% |
| T8: review |
9 |
283 |
31 |
1.0 |
61% |
| T7: write tip (many) |
24 |
461 |
19 |
4.7 |
73% |
My sketchnotes are more popular by far. My technical notes are surprisingly durable over time, even though you’d expect them to be superseded by bugfixes, technical changes, better documentation, and so on. Posts as old as 2004 still turn up. Because people still get a lot of value from my old tech posts, I adjusted the “Save time” rating for tech tips from my original value of 3 to 4. (I had started with a lower value because I figured that not a lot of people would probably have run into the same issues I did, but it turns out that time makes up for audience size and the long tail works.) As I expected, tips that few other people have written about get more pageviews than tips that more people have written about, although I’m surprised that people tend to spend more time on the common tips. My “thinking out loud” posts are more popular than I expected. Also, people tend to click on my weekly reviews if I add a brief description to the title, so that’s something.
Limitations: This only looks at single-page views in a single month. Also, I picked July because I started drafting this post in August.
Anecdotally speaking, I get a lot of comments and links to my sketchnotes. I’m also delighted by the conversations that occasionally grow out of the “thinking out loud” posts, and how sometimes people will share even better solutions when I post my technical notes.
4. Identify ways to improve each approach
Now that you’ve looked at what makes each type of post different, you can focus on how to improve each type by building on its strengths or compensating for its weaknesses. Here’s what I’m planning for the kinds of posts I write:
Draw original stuff: It takes me 2-4 hours to make one of these. I like making technical notes (ex: Emacs), sketchnote tutorials (to help people draw more), and other drawings related to life and planning. I’m getting used to drawing them with less up-front planning. Even though I end up moving things around, I think it’s useful to just get started. Drawing involves a trade-off because images are not as searchable as text. I can fix that by including the text, but it’s a little awkward and it takes more time. Still, people like the drawings a lot, and I like them too.
Draw book reviews and events: I go to fewer events these days, but I’m reading a lot more books. It takes me two hours to read a typical business book in depth, drawing notes along the way. I tend to draw book reviews only when I’ve already gotten a sense that a book is worth reading in depth. One way to increase my frequency is to draw book notes based on the skimmed parts of books that I’m not reading deeply – perhaps breaking out just the chapter or idea that resonates with me, and using that to illustrate a blog post reflecting on it. I can also work on getting more high-quality books into my pipeline, or practise by drawing more books with fewer value judgments.
Think out loud: I can improve the “Save time” score by stashing the notes in my outline, adding observations, until I’ve fleshed it out enough for preliminary findings and advice. It means that the output will be more concise in its reasoning and I’ll have to do more learning on my own instead of opening up the conversation early, but then the posts will be useful for other people as well as for me. Mr. Money Mustache is a good example of a blog that mixes personal stories and useful observations. The main thing that was holding me back from doing this before was losing track of my drafts, but my outline is a good step.
For example, this post started as a rough outline, thinking out loud about what kinds of posts I wanted to write. Now I’m going back and filling it in with other information that might be useful for people. If it ends up too long, I might have to trim it. We’ll get there!
Share tech tips, troubleshooting notes, or code: The limiting factor here is that I’m not working on any professional projects that I can write about, so I’m forced to run into and resolve fewer issues. I can replace that with working on my own projects or on open source projects, or helping people with questions. I often tweak or work on things related to Emacs, WordPress, or data visualization, so there’s that. If I set aside time and find a good source of small bugs so that I can ease my way into a habit of contributing to open source again, then that will also help me with my life goal to keep my technical skills sharp.
Review longer spans of time: I can increase the frequency of decision reviews by scheduling them so that I don’t lose track of items. Because I manage my outline in Org Mode, that should be relatively easy to do. I can also bootstrap this by reviewing last year and last decade’s monthly reviews (if available), or the blog posts if not.
Write tips that few other people can cover: There are lots of information gaps to fill. Sometimes it’s because people don’t have the time, inclination, or confidence to write about something. Sometimes it’s because I have a useful combination of skills or I can bring a different perspective. If I can’t find information, that’s a good reason to write it.
Write tips that other people can also cover: The world doesn’t really need another “how to find the time to blog” tutorial. If I can filter through search results for a good one and make it more findable, that beats writing one from scratch–unless I can add something special or relate different types of advice to each other.
Review recent posts (weekly, monthly): These are low-value in the short term (mostly lists of links, plus the nudge to do my weekly planning process), but I’ve found them to be surprisingly useful over the years. They also help keep my large blog archive manageable. That’s why I keep posting them. I’ve started using the weekly and monthly reviews to give people less-frequent subscription options (daily can be a little overwhelming), so that’s helpful too.
One way I can increase the value of the weekly reviews is to add more quick notes to them. For example, in my most recent weekly review, I included an annotated list of links I clipped and books/movies I liked from this week’s haul. I think it will provide additional value, and it’s a good way for me to review them as well.
Wrapping up
“Get better” is a vague goal. If you can identify the specific goals you would like to work toward, different ways to move towards those goals, and specific actions you can take to improve those approaches, you’ll have a lot of flexibility in terms of growing. You’ll find it easier to recognize or create opportunities to grow, and you can track your progress along the way. You might also be able to identify counter-productive approaches and replace them with ones that move towards more of your goals. Good luck and have fun!


