Categories: geek » quantified

RSS - Atom - Subscribe via email

Quantified Awesome: Analyzing time data–the questions I ask and how I answer them

Posted: - Modified: | quantified

I track my time using QuantifiedAwesome.com because I’ve built an interface that fits the way I work (mobile/web, lets me backdate entries, lets me disambiguate categories with text), but you can use whatever works for you – even a paper notebook where you write down the time and the category.

Here are some of the questions I ask about time and how I slice the data to answer them.

First level of analysis

There are a lot of things you can quickly analyze based on time, particularly if you have durations already pre-calculated. Here’s what I often look at:

How much sleep am I getting? To answer this question, I split my time records by midnight so that I can easily get the sum of sleep durations per day. This accounts for naps and late nights much better than just looking at the starting timestamp does. I can quickly check my sleep length by looking at my dashboard, which shows me how much sleep I got the previous day. I also have some Emacs Lisp code that gets the data from QuantifiedAwesome using an API and calculates my average sleep for a week, which I include in my weekly reviews.

Am I working too much? I want to keep my “Business – Earn” total to less than or equal to 20 hours per week (50%), and my total business-related hours to be less than 44 hours per week. I do this because otherwise work can be tempting to focus on, and I want to remind myself to do other things as well. This is reported on my dashboard, and I also see it in my weekly reviews.

How much discretionary time do I have? How much time do I have for hobbies, socializing, and other activities outside work, chores, personal routines, and sleep? This helps me appreciate the freedom I have in each day and to focus on making the most of it. I can quickly see this by looking at the “Discretionary” row in my time review, or by adding categories and summing up the times in my spreadsheets. This is particularly mind-boggling to look at over a year. I had 1563 hours of discretionary time in 2012 – that’s a decent-sized time for developing skills or building relationships.

What do I spend my discretionary time on? How much am I using for socializing, productive interests, and relaxation? I answer this question by looking at my time review or by creating pivot tables in my spreadsheet. It turns out that I spend more time on social things than I expected, so I don’t feel as guilty about blocking off time to work on my own things. I also have a lot of productive hobbies, so I can give myself more permission to play with less productive things or give myself downtime.

Second level of analysis

This might involve throwing your data into a spreadsheet and playing around with it. Here’s where I start digging into patterns and correlations.

If I spend more time on some activities, where do I spend less time? I looked at correlations for time spent on various activities per day.

How consistently do I do things? I’m curious about whether my sleep times, bedtimes, workload, etc. vary wildly from week to week or if they’re fairly stable and predictable. It’s easy to get a sense of this by looking at graphs and calculating standard deviations.

How does my bedtime affect my wake-up time? I compared starting timestamps with ending timestamps, discarding naps and differentiating between weekdays and weekends. (I should rerun this analysis now that I have more control over my wake-up times…)

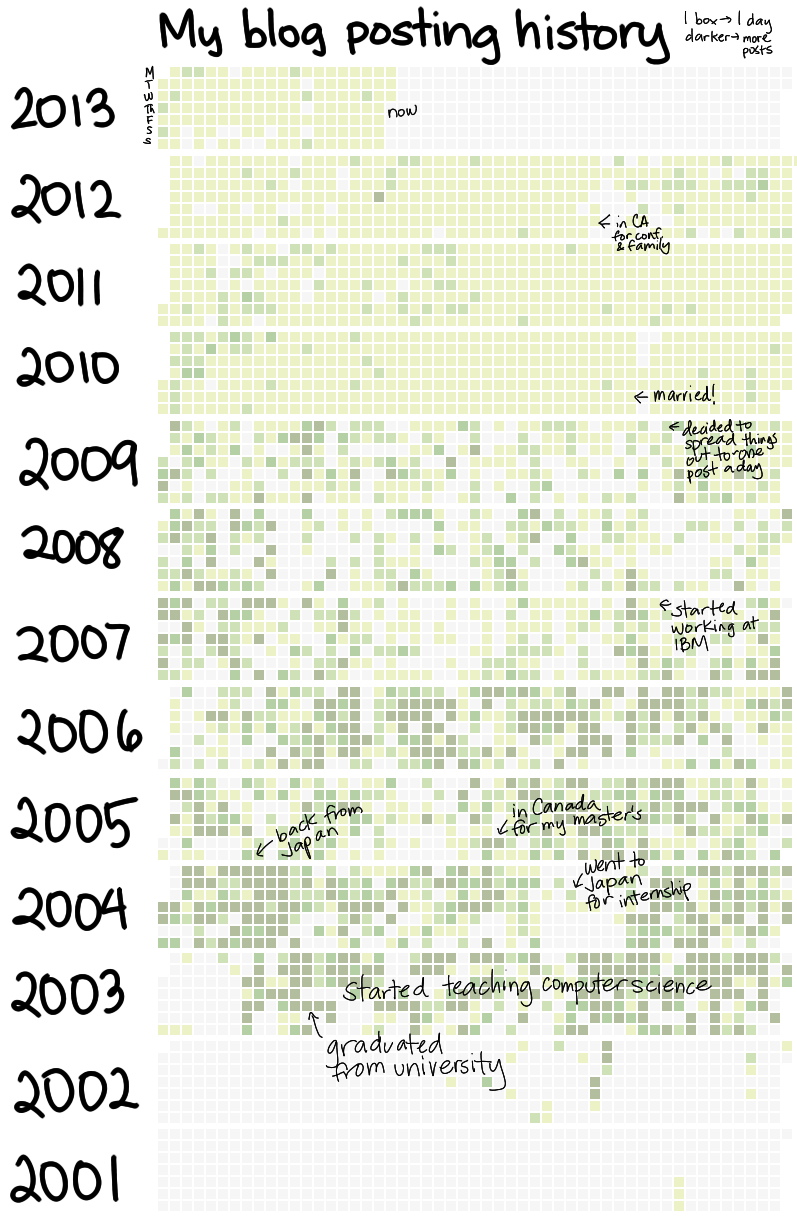
How frequently do I write? I extracted the date from each timestamp and visualized it using a heatmap.

How consistently do I bike, and when’s the earliest I started biking this year? How much have I saved by biking? I review my bike time or visualize it as a pivot table, a bar graph, or a heatmap in order to see patterns. (I biked in January! =D) Since most bike trips replace public transit trips (currently $2.60 per trip), I can also use my time data to estimate how much I’m saving. (259 trips in 2012 = ~$670+, 122 trips so far in 2013.)

Do I need longer chunks of time to concentrate? I looked at discretionary activities and counted how many took 4+ hours, 3 hours, 2 hours, 1 hour, or less than an hour. I look at the character of the activities, too, so that I can figure out what I might not be working on if I only have short periods of time. It turns out that I get a lot of things done even in 1-2 hour chunks, and I tend to not take advantage of longer chunks even if I have them. (Hmm, I should do an analysis to see the longest chunks of straight discretionary time I have…)

Does waking up early give me more discretionary time or longer chunks of time to work with? It turns out that I actually have a lot of “me” time even if I wake up at ~8 AM. Since this meshes well with my sleep needs if I stay up to 11 PM or 12 midnight, I can guiltlessly sleep in knowing that I’m not missing out on a lot of productivity.

How does bulk cooking affect our time? How often do we do it? I look at sparklines and pivot tables to get a sense of when we’re doing lots of bulk cooking. (I should analyze this to find out how much time we actually save and where it goes to…)

How do my patterns shift over time? What hobbies did I pick up or let go? How does my life adapt to external events and other commitments? Pivot tables, sparklines and line graphs are great for looking at the patterns in my data.

How much time does it take me to get somewhere compared to, say, the estimates from Google Maps? I can figure this out by looking at the estimate before the trip and then comparing it with the time I’ve logged (door to door ). For example, a recent bike trip that was 32 minutes in Google was actually more like 43 minutes (including waiting for downtown traffic lights and finding someplace to lock up my bike). My morning commute is 36 minutes according to Google and around 48 minutes by my clock.

Third level of analysis: What do I want to do with my life?

This is where I take a step back and check: Am I happy? Is W- happy? Do I need to shift the way that I spend my time? What would I like to move my time towards? Am I getting the kind of value that I want to get out of my time? Then I can experiment. For example, I’m currently experimenting with increasing the time I spend exercising, and I’m curious about how that affects other parts of my life.

Wrapping up…

You can get a ton of information out of simple time tracking, even without anything else to correlate it with. Durations, start and end times, frequencies… There’s a lot you can do with a spreadsheet, some charts, or your own tools.

It gets even more interesting when you start matching it up with other data. One day I should try comparing my bike data with temperature and wind, or time spent cooking with how many portions we produce and at what cost per portion. =)

I get a lot of value out of my time-tracking. It helps me stay focused and be aware of the moment. I like reviewing and analyzing my data, too. I’m experimenting with ways to capture short sprints of more detail so that I can ask even more questions, and I love comparing notes with other people who track their time.

Check out more posts about my Quantified Self tracking!

Poll: How often would you like to receive e-mail updates? Also, quantifying my blog posting history

| blogging, quantified, wordpress, writing

I’ve been posting practically every day for the past 3.5 years, and I write about a variety of topics. I’ve been thinking of ways to make it easier for people to keep in touch without E-mail newsletters seem to be a Thing. Right now, the e-mail subscription form on my blog is the default provided by WordPress, so people get daily updates (which is probably a bit much). I’ve been thinking of making it easier to subscribe to weekly or monthly updates. Would you find something like that useful? I’d really appreciate it if you could answer this poll!

[poll id=”1″]

(Don’t see the poll? Try viewing this post on my website.)

Aside: I was curious about just how long I’ve been keeping up with this ~1 post a day thing, so I graphed my blog posting history. It turns out that I’ve been pretty consistent, although there were days when I didn’t have anything new posted. I schedule my blog posts using Editorial Calendar and I sometimes send people sneak previews of upcoming posts using the Share a Draft plugin. This lets me smooth out the spikiness of my writing habit into a more predictable publishing schedule.

blog-posting-history

To generate this graph, I extracted the timestamps of all my published posts with the following SQL query:

SELECT UNIX_TIMESTAMP(post_date) FROM wp_posts WHERE post_type='post' AND post_status='publish' 
INTO OUTFILE '/tmp/timestamps.txt';

… and then I graphed it with cal-heatmap, removed in-between labels in GIMP, and used Autodesk Sketchbook Pro to hand-write new labels. =)

Quantifying my habit of writing, and things I’ve learned along the way

| blogging, quantified, writing

Leo Babauta wrote about the power of writing daily, sharing what he’s learned from about five years of daily writing. It got me curious about how consistently I write.

Since I schedule my blog posts, my blogging history doesn’t give me useful data. Fortunately, I can get that data from my time-tracking. Here’s a graph showing how much time I spent writing between January 2012 and April 2013, with the greenest areas for days of about 4 hours of writing. In total, I spent 346 hours writing, for an average of 0.7 hours per day or 5 hours a week. I wrote during 254 out of 486 days (58% of the days), or roughly every other day.

My longest streak of non-writing was 8 days of not writing (September 2012, when I was on a trip with my family). My longest streak of continuous writing was 12 days of writing every day (June 2012).

image

imageI usually start writing between 7 PM to 9 PM (after dinner), but I also write at other times. With the more flexible schedule I get to have these days, I go on a writing sprint whenever I want to.

One of these days, I should put together a graph that takes into account how long I spend writing, too.

It turns out that I write a lot, although it doesn’t feel that way looking at it one day at a time. In 2012, I wrote around 133,000 words for my blog. This is slightly more than the number of words in Jane Austen’s Pride and Prejudice, but nowhere near as awesome. I clocked 268 hours for writing during that year, so that works out to a really low 8 words per minute. I already know that the bottleneck is my brain, not my typing speed, though. =) The time includes writing non-blog stuff as well as discarded posts, but hey, it still gives me a good general idea.

Anyway, some quick non-data thoughts on what Leo said about the benefits of writing, and what I want to add:

  • “Writing helps you reflect on your life and changes you’re making.” I do this a lot with my blog – looking backward to review decisions, looking forward to explore the possibilities. Not only is writing a good excuse to ask yourself these questions, but having a record of your reflections, reasons, assumptions, and predictions also helps you make better choices.
  • “Writing clarifies your thinking.” It’s easy to fool yourself into thinking you understand something if it’s just inside your head. Once you try to explain it to other people, though, you’ll quickly find gaps. Writing is one of my ways of thinking out loud. My thoughts are fuzzy and elusive until I sit down and write a blog post, a note, a list, or draw a mindmap or a sketchnote. I figured that it’s okay to be wrong in public from time to time, and it’s better than never knowing about mistakes.
  • “Writing regularly makes you better at writing.” I suspect that rewriting is an even more useful technique for better writing. I don’t do as much rewriting and editing as I probably should, although I often revisit and write about old topics based on new questions or ideas. That said, writing is great for practising organizing your thoughts and figuring out how to communicate them, and regular blogging is a great way to experiment with different techniques.
  • “Writing for an audience (even if the audience is just one person) helps you to think from the perspective of the audience.” I like writing for myself, and I also like writing for other people. It’s fun to answer questions or to build on other people’s thoughts.
  • “Writing persuasively — to convince others of your point of view — helps you to get better at persuading people to change their minds.” I’ve mostly given up on persuading people to change their minds, having read quite a few argument/rhetoric/persuasion books that made a lot of sense to me. Now I go for the low-hanging fruit of sharing tips and ideas for people who’ve already decided, and helping illuminate the possibilities for the people who are on the fence. =) Still, practice in examining and organizing my thoughts helps a lot when it comes to making better decisions or helping other people with theirs.
  • “Writing daily forces you to come up with new ideas regularly, and so that forces you to solve the very important problem of where to get ideas.” Since I write about whatever I’m learning about, writing encourages me to keep learning. I don’t promise a particular set of topics, though, so I don’t feel that pressure to keep coming up with good material. Besides, there’s so much to learn and share!
  • “Writing regularly online helps you to build an audience who is interested in what you have to share, and how you can help them.” This is actually pretty darn awesome. Connecting without small talk, yay! =)

Writing is well worth the time for me. I wonder what would happen if I doubled the time I spent on writing, maybe splitting the extra time between research and editing… Hmm.

Is writing worth it for you, too? What’s your experience like? How would you increase its benefits?

zenhabits: Why You Should Write Daily

Quantified Self: a year of grocery data

| quantified

I started tracking our grocery expenses when we decided not to sign up for a community-supported agriculture program. I’d tracked several seasons of the CSA, and I wanted to see if we would still eat lots of vegetables without the bi-weekly commitment of a farm share. I also wanted to get a sense of what we bought.

I started scanning my receipts, and I found an assistant who could type them in. I set up a spreadsheet where he could type in the dates, stores, and line items (including quantity, unit price, and total). There were occasional typos, but I could find and fix them. I used a look-up table to match the line items with friendlier names (ex: RDPATH SUGAR is white sugar) and file them under categories.

The data below isn’t complete because there were a number of receipts that slipped through the cracks. If I let too much time pass between data updates, I couldn’t remember what some things were. Still, it should give a general idea of how the year went. The data covers April 2012 to March 2013 and includes 1223 line items.

Here are some questions I wanted to explore:

  • A. How much did we spend in various categories, and how does that vary month by month? For example, how much do we spend on vegetables? Is this in line with what we want our diet to be?
  • B. What items do we spend the most on? This could point to better ways to economize (buying in bulk, finding cheaper choices) or show us where it’s worth spending on better quality because we use so much of it.
  • C. How frequently do we buy certain items? Can we predict consumption patterns or sale patterns, and stock up when things are on sale?
  • D. What are the normal prices and the sale prices for various items? When and where does it make sense to buy different things?

So, let’s see! Click on the images to view larger versions.

A. How much did we spend in various categories, and how does that vary month by month?

image

Grocery expenses worked out to be $422/month for this family of three in Toronto, Canada. We ate pretty well, enjoying our favourite foods, the occasional snack, and fresh fruits and vegetables, and buying organic milk (which turned out to be a large part of the budget, but probably worth it). Because we cook in bulk, some months have larger grocery bills and some months involve more freezer-raiding. The standard deviation was $160.

We spent the most on meat ($59/month) and dairy ($53/mo), but fruit ($47/mo) and vegetables ($46/mo) also made a respectable showing. Vegetables worked out to $22 every two weeks, which is less than what we were paying for the CSA box. That could be accounted for as a pricing difference between conventional and organic produce, and we still bought extra vegetables when we were in the CSA. Paying attention to our increasing vegetable spending helped us learn lots of ways to prepare food. Yakiudon turned out to be a house favourite, and other stir-fries are great too. We haven’t been able to get our vegetable spending to overtake meat, but that’s probably because of the occasional indulgence in lamb korma.

The month-by-month pattern made me think there were bigger differences, but because stocking up and bulk cooking means our monthly patterns probably aren’t a good source of information. Our vegetable spending is positively correlated with our overall grocery spending (0.7), which means that ~50% of the ups and downs are explained by the ups and downs in our grocery bill (maybe we just bought less).

Anyway, I feel pretty good about how the proportions worked out. There’s hope for us yet!

B. What items do we spend the most on?

image

We buy milk because J- likes it. It turns out that Canada prohibits the use of artificial growth hormones for dairy cows and antibiotics are also controlled, but we still get the organic version for extra safety. Lamb shanks from the butcher are a splurge when it comes to making lamb korma. We found that Metro often has the lamb cuts we want, though, so we check there first now. Shrimp sees a lot of use in pad thai, stirfries, and other wok-based dishes, plus our occasional wonton marathons. My standard breakfast is rice and fried egg, and we use lots of eggs in baking and stirfrying too. I was surprised that much butter (and we do, even though we try to stock up during sales!) because of baking, and that grapes made it into our top ten despite being something we don’t eat that often. We buy grapes only when they’re super-crisp, and sometimes we forget to eat all of them before they soften. Also, we usually buy chicken legs or drumsticks, but it was interesting to see that whole chickens turned up on this list even though we don’t buy them frequently.

C. How frequently do we buy certain items?

A block of butter, a carton of 18 eggs, and a bag of 4L milk every 1.5 weeks (eggs and milk feel more frequent than that, though…)
A 2kg bag of white sugar every ~2 months, a 1kg(?) bag of demerara sugar every ~6 months

It’s a little harder to tell how often things go on sale and how much we want to stock up, because we skip sales if we still have stuff in stock (ex: butter) and we shift our buying patterns depending on what’s on sale (ex: 30% on a particular meat package that’s nearing its best-by date). It looks like butter is always good to get on sale, though, and that seems to be every other month.

D. What are the normal prices and the sale prices for various items?

Hmm, I think it might be useful to remember which ones sometimes go on big sales, so then it makes sense to postpone until things are in season.

Butter is usually $4.97, sometimes $2.88. Salami is sometimes $4.20 off ($5.29), clementines are sometimes $3 off ($3.99), and bacon is sometimes $2.58 off ($2.97). Sometimes we can get Japanese udon noodles for $1 instead of $2.19. And then there was that time that Campbell’s condensed chicken soup was on sale for $0.50 instead of its usual $0.97, and we bought a lot. =)

In general, our neighbourhood No Frills supermarket has pretty prices for stuff, although some things necessitate a special trip to the Sweet Potato organic food store or the Welcome or Oriental Harvest ethnic supermarkets. Metro also stocks some sauces and lamb cuts that are hard to find elsewhere. I sometimes look up prices from my records, but the difference is usually pretty small.


So that’s roughly a year of data. Hmm… Should I continue? Maybe I’ll scan and stash the receipts, but I might not have someone type in the information until I have more questions I want to ask. It was interesting to collect that data over a decade, though!

Quantified Self time-tracking: Choosing your buckets

Posted: - Modified: | quantified

This post missed its publishing schedule. I’m posting it today so that it doesn’t get lost.

Kate asked me how I chose the categories I use for tracking my time, and if I had any tips for someone who’s starting out.

I track my time at a medium level of detail – not so high-level that I can’t ask interesting questions, but not so low-level that it’s hard to summarize. To select an activity category (the non-bolded text in the table below), I type in parts of it. For example, “un subway” becomes “Unpaid work – Subway” and “quantified” becomes “Business – Quantified Awesome.” If something is ambiguous, the system shows me all the matches and lets me pick one. I can make some activity categories inactive so that they don’t get matched by the search. If the text doesn’t match anything, I’m shown the category creation screen, and the timestamped record is automatically created once I create the category for it. For “Other”-type activities and other activities that I’ve added a note field to, I can add a pipe character followed by a note (ex: “disc other | Yada yada yada”) for more details.

Here’s the general structure. I based the top-level categories on the OECD time studies so that I can compare my numbers with averages from other developed countries. The top-level categories I use are:

  • Business: Anything related to entrepreneurship or professional development
  • Discretionary: Hobbies, socializing, and other ways I choose to spend time
  • Personal: Personal care, daily routines, exercise, and things you can’t outsource because the point of the activity is personal benefit
  • Unpaid work: Chores, commuting, and other things you could theoretically outsource or eliminate
  • Work: Working as an employee; also, the occasional work lunch
  • Sleep: Sleep and naps!

The second-level group (Business – Build, Business – Connect, etc.) are the ones I recently created for reporting purposes. They look useful, so I might figure out how to build them into my database for more reporting goodness.

Within those major groups, I have one or two levels of record categories that I really use to track time. The higher groups are just for reporting. I create more activity types as needed.

Business
Business – Build
Business – Android
Business – Book review
Business – Business development
Business – Coding
Business – Delegation
Business – Drawing
Business – Learn
Business – Marketing
Business – Other
Business – Paperwork
Business – Plan
Business – Quantified Awesome
Business – Research
Business – Sales
Business – Connect
Business – Connect
Business – Correspondence
Business – Presentation
Business – Pro bono
Business – Earn
Business – Consulting – E1 – Conf
Business – Consulting – E1 – General
Business – Consulting – R1
Business – E-book
Business – Illustration – I1
Business – Illustration – I2 – UPV
Business – Illustration – I3 – M
Business – Illustration – I4 – SR
Business – Illustration – I5 – MT / G
Business – Sketchnoting
Discretionary
Discretionary – Other
Discretionary – Play
Discretionary – Harry Potter (… because I forgot I already had “Discretionary – Play – LEGO Harry Potter”)
Discretionary – Play – Final Fantasy
Discretionary – Play – Katamari Forever
Discretionary – Play – LEGO Batman
Discretionary – Play – LEGO Harry Potter
Discretionary – Play – LEGO Heroica
Discretionary – Play – LEGO Indiana Jones
Discretionary – Play – LEGO Lord of the Rings
Discretionary – Play – LEGO Pirates
Discretionary – Play – LEGO Star Wars
Discretionary – Play – Nethack
Discretionary – Play – Other
Discretionary – Read – Nonfiction
Discretionary – Relax
Discretionary – Productive
Discretionary – Emacs
Discretionary – Gardening
Discretionary – Latin
Discretionary – Read – Blogs
Discretionary – Read – Fiction
Discretionary – Sewing
Discretionary – Tracking
Discretionary – Travel
Discretionary – Writing
Discretionary – Social
Discretionary – Family
Discretionary – Social
Personal
Personal – Exercise
Personal – Bike
Personal – Exercise
Personal – Scoot
Personal – Walk – Home
Personal – Walk – Other
Personal – Walk – Subway
Personal – Walk – Work
Personal – Life
Personal – Eat – Breakfast (… sometimes I track meals separately, but usually they’re just part of Personal – Routines)
Personal – Eat – Dinner
Personal – Eat – Lunch
Personal – Plan
Personal – Planning (… because I forgot I already have Personal – Plan)
Personal – Routines
Sleep
Sleep
Sleep
Unpaid work
Unpaid work – Commute
Unpaid work – Subway
Unpaid work – Wait
Unpaid work – Errands
Unpaid work – Groceries
Unpaid work – Home
Unpaid work – Clean the kitchen
Unpaid work – Cook
Unpaid work – Laundry
Unpaid work – Tidy up
Unpaid work – Other
Unpaid work – Other
Unpaid work – Other travel
Work
Work
Work – C
Work – Lunch
Work – O
Work – Other
Work – T

I track business projects as their own categories so that I can bill for my time or figure out if something was worth doing. I track games separately so that I can figure out what I spend more time on.

I usually create a tracking record at the beginning of the activity so that quantifiedawesome.com can timestamp it. If I forget, I can say things like “-15m relax” to note that I started relaxing 15 minutes ago, or say things like “13:30 writ” to note that I started writing at 1:30 PM. If I’m seriously late, I can specify the date like this: “3/24 19:05 social”, or use the batch entry form. When I record an entry, the system shows me the edit form, so if I was wrong (I thought I was going to start Personal – Routines, but really, I went back to sleep), I can change the category using a dropdown and save it. I can also adjust start and end times, and the previous or next record is automatically adjusted too.

I track my time based on the primary activity so that I don’t double-count the time. For example, if I’m taking the subway, I file it as “Unpaid work – Subway” instead of “Discretionary – Read – Nonfiction” even if I read a book during the trip.

I have to build some kind of split/merge/refactor activity category tool someday, but so far, this is fine. And more reports! Reports are fun.

Tips and lessons learned:

If you’re starting out, a simple thing that lets you capture some text with a timestamp will work just fine. Jot down a few keywords that explain what you’re doing – enough to remember. Do this for a few days to a week in order to get a sense of what categories you may want to file things under.

Once you’ve figured out what general categories you want, use a button-based tracker like Tap Log or a list-based tracker like Time Recording (both Android). They’re great for selecting something from a defined list or structure. The downside is that it takes a liiittle more time to add a new category.

When you have lots of categories, going back to text input makes a lot more sense. No scrolling, no clicking around, and you can add new things fairly quickly. The substring search I put into quantifiedawesome.com works really well for me because I know which shortcuts map to which categories, and the structure is better than freeform text because reporting is easier.

Reporting is a lot more fun if you’re comfortable with spreadsheet pivot tables and other nifty features. I should do a screencast of how I use Excel to slice and dice my data. =)

Next step for me: Time estimates

I’ve started recording time estimates for more detailed tasks/activities so that I can a) figure out if I routinely overestimate or underestimate certain things, and b) get finer-grained time data. I know that it takes me roughly an hour from the time I get up to the time I get out of the house with my usual morning routine and maybe half an hour for the rush version, but it would be great to break that down into components and perhaps experiment with it. I’m also curious about how much time it takes me to get to places so that I can adjust Google Maps estimates for walking, biking, or public transit.

I write predictions down in Evernote (“Predict home by 7:05”). Evernote automatically timestamps the creation date, and I update the note with the actual time and any other notes I want to include (“home at 7:03; bike”). When I have several estimates and measurements, I’ll make a spreadsheet. When the spreadsheet structure settles down, I might build the functionality into Quantified Awesome. Successive prototyping helps me figure out how the data feels before I spend time building a structure for it. =)

So that’s how I track my time! See Where the Time Went for a recent presentation sharing my results.

Quantified Self Toronto: Where the Time Went

Posted: - Modified: | quantified

Update 2013-6-6: Added a link to the video!

Carlos Rizo convinced me to quickly throw together a presentation for today’s Quantified Self Toronto meetup. Here are my slides!

Where the Time Went – Quantified Self Lunch and Learn (March 27, 2013 – Toronto) from Sacha Chua
Here’s the video:  http://www.youtube.com/watch?v=R_htVMW3CSA

Check out quantifiedawesome.com for my data, dashboard, and source code, and read through my Quantified Self blog posts for more geekery.

Quantified Awesome feedback

Posted: - Modified: | quantified

I just realized that my feedback form on Quantified Awesome didn’t let people fill in their e-mail addresses, and people didn’t think of adding it to their message… d’oh! So I’ll just respond to questions here and hope that people who checked out Quantified Awesome happen to also have subscribed to my blog.

Hi Sacha,  I looked at the statistics that you are collecting here (at quantifiedawesome.com).  One one hand it seems very beneficial for personal development/goal tracking and other uses.  On the other hand the feeling that someone else might read my stats and know in so much detail how I live gives my shudders.  Is there a way to keep one’s privacy while collecting useful personal stats?

My data is the only one that’s public. Theoretically, I have access to the database, but I won’t post anything. Also, there’s no SSL, so someone could potentially sniff your password and look around. But it’s probably okay. If you really want to keep things private, I suppose you could track using pen and paper or a spreadsheet on your computer.

Your blog is crazy interesting to me.  I’m curious about your quantification approach.  Any inspiration from Nicholas Felton at feltron.com?
Oh and crop your clothes photos more closely.  Don’t need to see the hanger and wall but more detailed shot of the clothes would be nice.
Best
Pat

I checked out his annual report some time ago. It’s pretty, and people often point me to it. The data visualizations are neat, but I’m even more curious about his ongoing data collection and analysis processes. =) Clothes photos: That’s possible, but I can’t be bothered at the moment. Winking smile Minimal effort wins out.